

Involve
A digital engagement platform for collective intelligence and large-scale qualitative data collection
Rethinking Inclusion
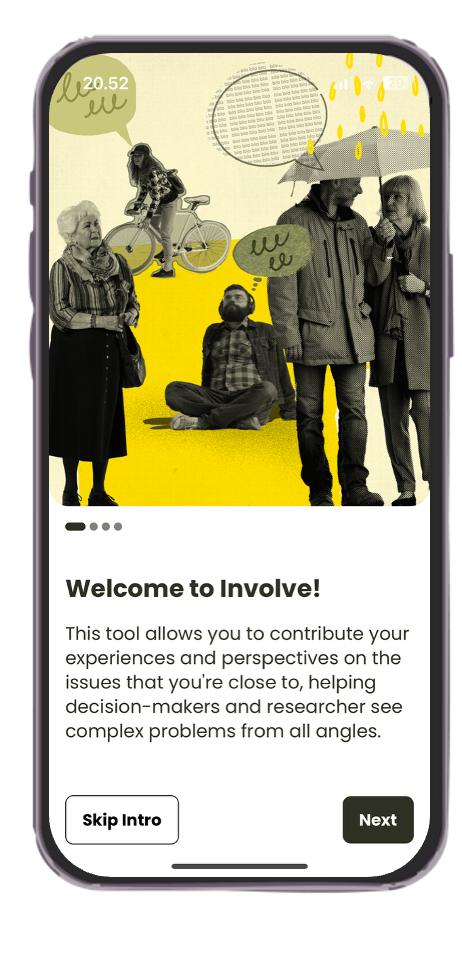
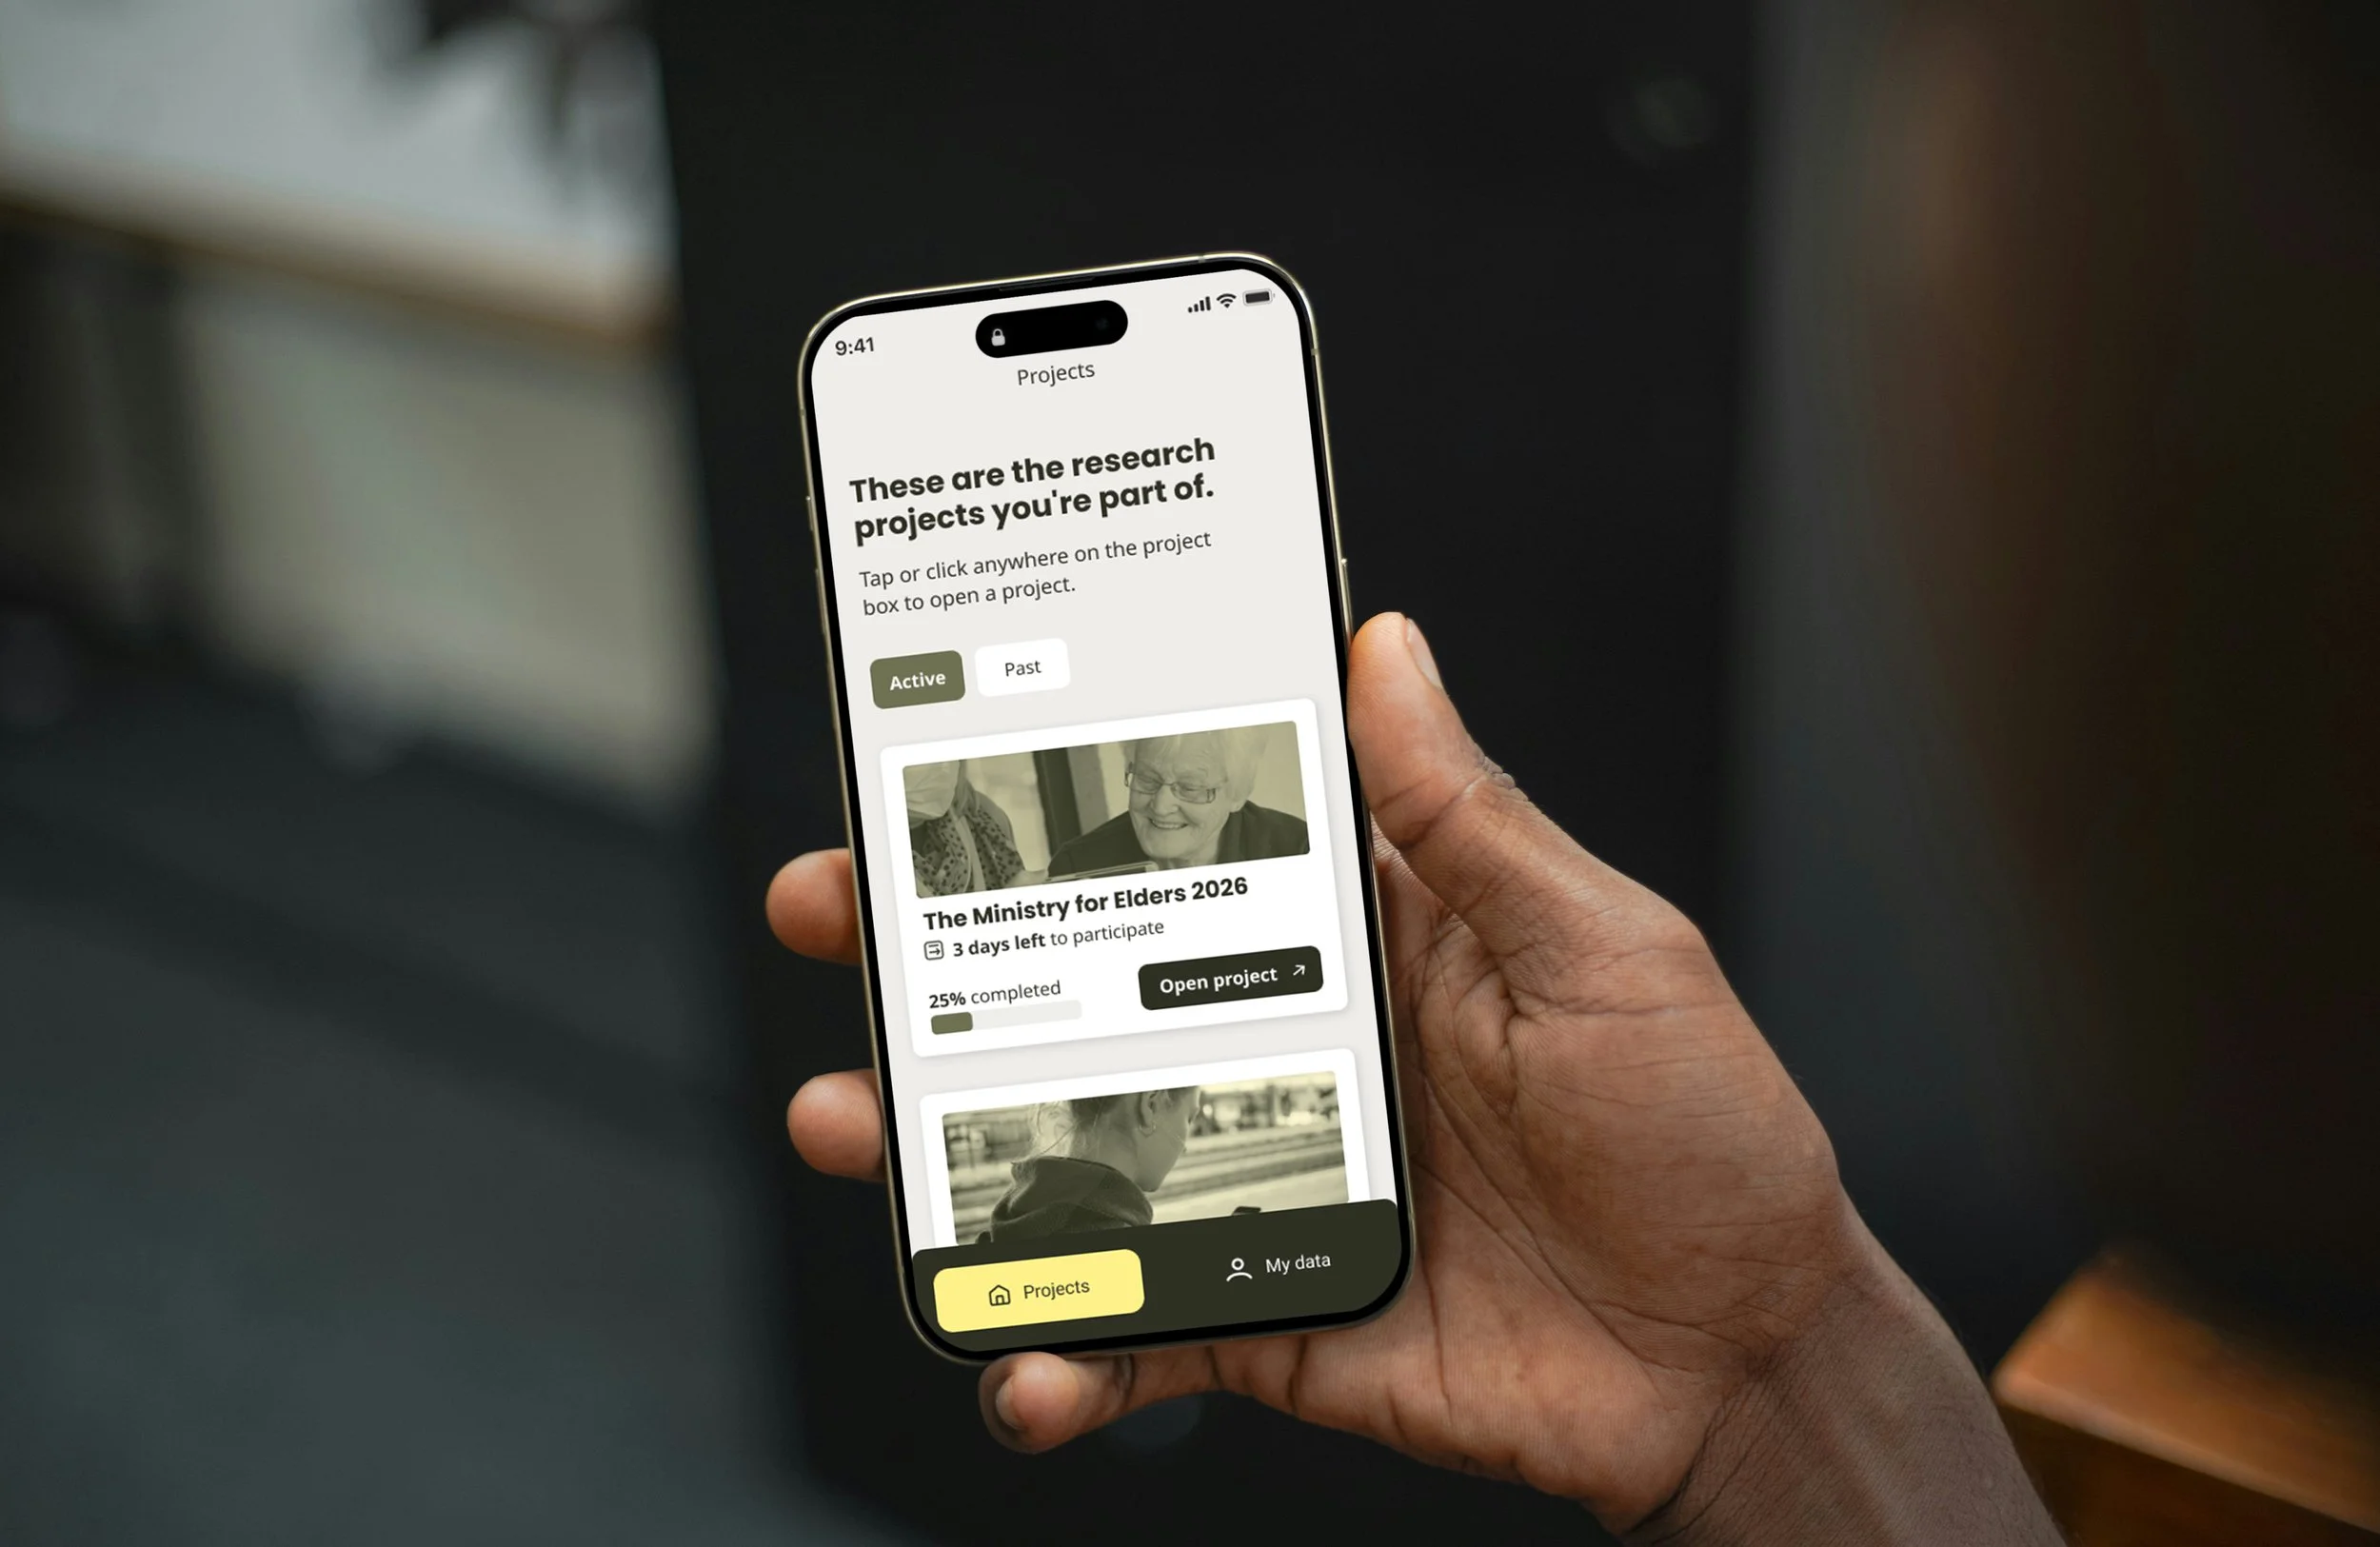
Involve is a web and mobile app created as a dynamic tool for collecting exploratory data on a large scale. With Involve, citizens, practitioners, experts, and partners are invited to share their knowledge in an accessible and intuitive way that can be customized to the individual—through images, voice messages, or text responses.
Involve is designed to understand and follow complex issues through the experiences of those who work with or experience the problem – right where they are.
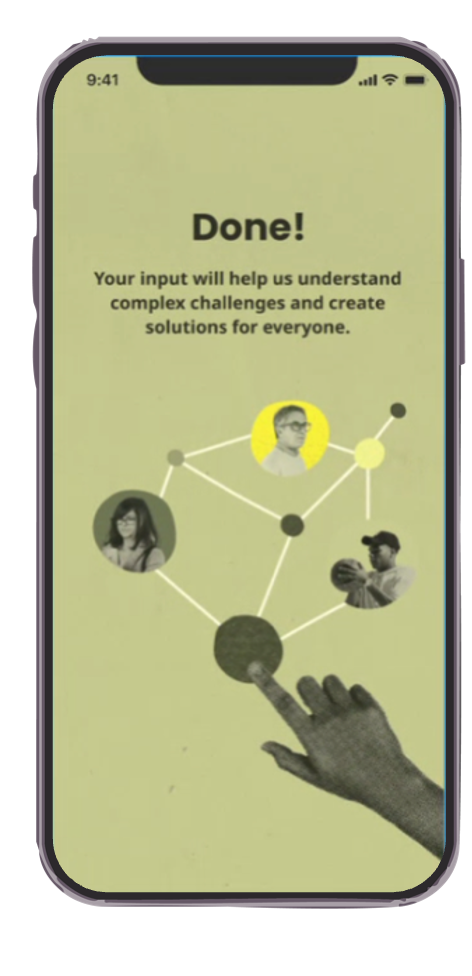
Using INVI’s Model for wicked , these insights can be transformed into structured knowledge. Statements from participants are visualized and grouped into cards that depict the problem landscape from the bottom up: What experiences and understandings shape how the problem is perceived? What are the dominant perspectives? Which problem definitions compete with one another, and what does the range of proposed solutions look like depending on whom we ask?

Designed to address three key challenges in inclusion
Involve is an alternative to traditional engagement methods such as surveys, public meetings, and consultation letters—approaches that, in their own ways, suffer from well-known problems that result in either the same resource-rich individuals showing up and being heard, or citizens primarily feeling that they are being asked to confirm or rank ideas and perspectives defined by decision-makers.
Involve was created to unlock the potential of engagement by overcoming three particularly persistent challenges in conventional methods.
-
Public willingness to participate in participatory processes is declining. This is due, first and foremost, to the fact that citizens are often asked only to choose between predefined problem analyses and proposed solutions. Furthermore, there is often a perception that contributions are neither heard nor translated into action. This leads to fatigue and mistrust. Instead, Involve focuses on creating processes where open responses are valued and where there is transparency regarding how they are used in the decision-making process.
-
Traditional methods—surveys, opinion polls, public forums, and town hall meetings—tend to favor those who are comfortable expressing themselves precisely in writing or speaking in front of a group. This excludes many people. To broaden participation, Involve is designed to meet people where they are and give them the opportunity to contribute in ways that feel natural. That’s why Involve lets users simply record voice messages, take a photo, or write freely—it lowers the barrier to entry and makes it easier for everyone to have their say.
-
Engagement that focuses on opinions often reinforces polarization: When you ask, “What do you think?”, it typically pushes people further into entrenched positions. When people, on the other hand, are invited to share their concrete experiences with a topic, we gain access to deeper and more nuanced knowledge. Involve supports experience-based contributions that anchor the mapping in the realities of everyday life rather than in abstract dividing lines or polarized positions.
Key features
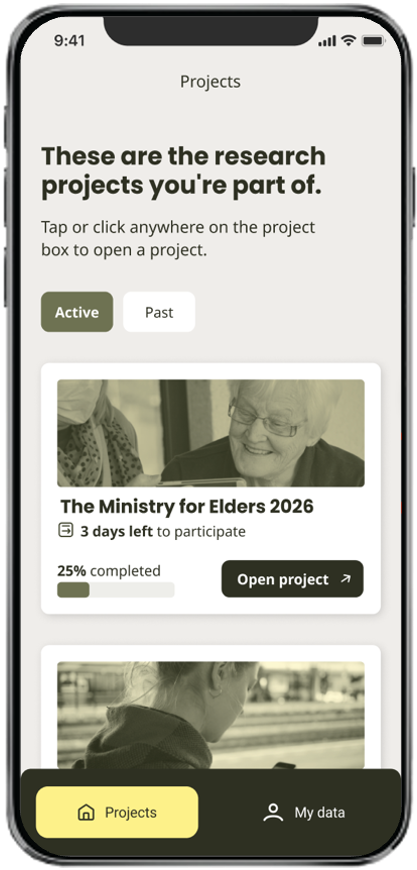
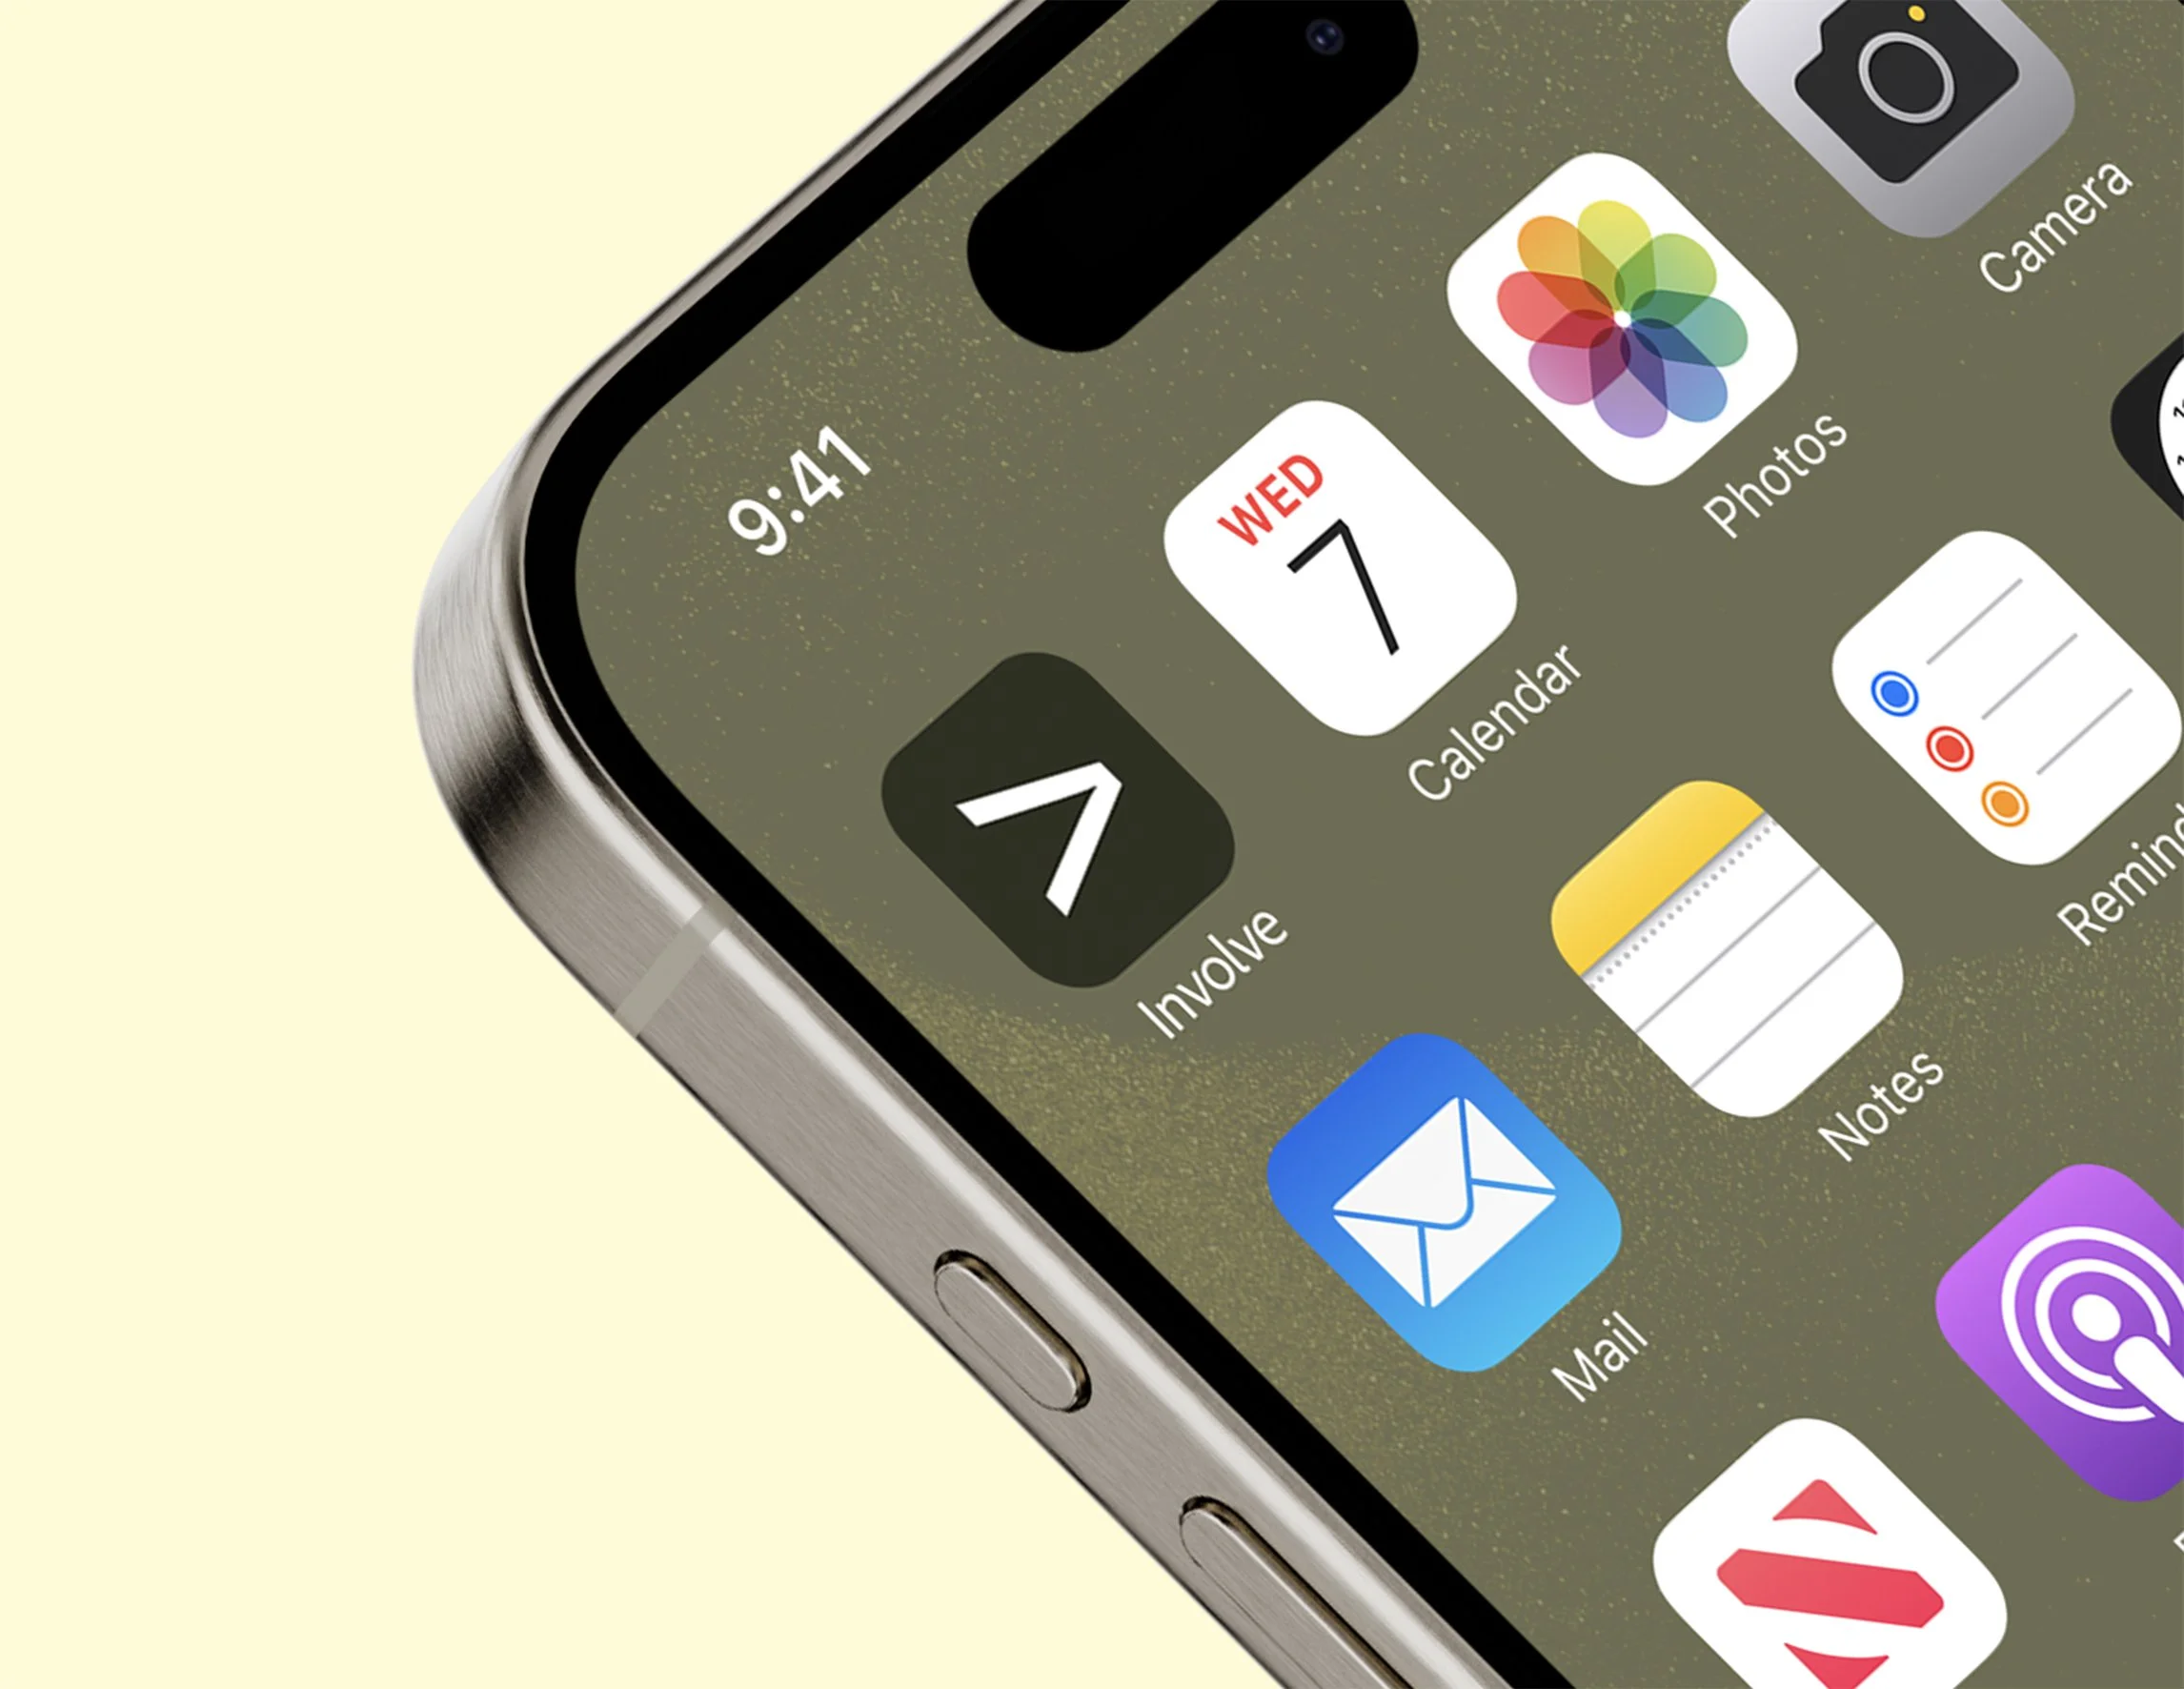
Involve is easy to use—both as a mobile app and as a web app. This applies both to you, who will use it to research a topic, and to citizens who want to share their knowledge.
It should be intuitive and accessible for everyone, regardless of age, background, or technical skills, to contribute their perspectives. That is why Involve is designed with the following in mind.
-
Involve is designed to meet people where they are. Whether you’re a project manager setting up a survey or a citizen sharing your knowledge, it should feel intuitive and accessible—regardless of age, background, or technical skills.
-
Participants choose for themselves how they want to contribute. Some find it easiest to express themselves verbally, while others prefer writing. With Involve, participants can answer questions using voice messages, text messages, or photos from their camera or photo gallery. We meet people where they are most comfortable.
-
Voice messages are automatically transcribed using built-in AI, so the spoken words are immediately available as text. The participant can review and edit the transcription to ensure the message is exactly as intended before saving it.
-
Once participants have shared their qualitative responses, you can invite them to take it a step further. With Involve’s annotation feature, you can ask participants to rank, categorize, or elaborate on their own responses. This adds an extra layer of data that combines qualitative depth with a structure that makes it easier to compare and analyze across many contributions.
-
Involve supports feedback rounds where, after participants have submitted their own responses, they can see how others have answered the same questions and react to those answers. You can ask participants to rate how much they agree or disagree, what their sentiment is toward a given input, or how important they find it. This adds a dynamic layer to the qualitative data collection, where individual perspectives intersect and provide a more nuanced picture of where there is consensus and where there is genuine disagreement among stakeholders.
-
Not everyone wants to download an app. That’s why Involve works as both a mobile app and a web app, accessible via a link directly in your browser. Same features, same freedom to speak or type.
-
As a project manager, we or our partners can quickly set up projects and onboard participants without requiring any technical expertise. You can also introduce the survey with a video to provide participants with context and motivation, monitor the project in real time, and export data directly from your browser.
-
Involve allows you to organize participants into groups, projects, and tasks, so the tool can be adapted to everything from large-scale national surveys to local engagement processes.
-
Project managers can moderate contributions before they are shared with others. Faces in photos are automatically recognized and blurred. Involve is fully GDPR-compliant and gives participants control over their own data.

What can Involve teach you?
Involve can be used in a wide variety of contexts. It’s about what the insights should inform, who should be involved, and how long a problem should be monitored. Here are some of the areas where Involve is already making a difference:

Politics, Laws, and Reforms
When new reforms are being designed and implemented, a knowledge gap quickly emerges between those who adopt the policy and those who have to live with it. Involve provides civil servants, ministries, and municipalities with a tool to gather experiences and feedback from citizens, family members, and frontline practitioners, and translates data into actionable knowledge that ensures policy initiatives are grounded in reality.

Foundations and NGOs
For foundations, NGOs, and other organizations working on political and social challenges, Involve makes it possible to identify what target groups, partners, and stakeholders actually experience and believe, rather than what is assumed they believe.
It can be used to establish a new strategy, measure whether an initiative is making a difference over time, or provide grantees with a common language for discussing their issue area.

Research
Involve is a powerful tool for large-scale qualitative data collection that enables you to work systematically with large volumes of rich, nuanced data without getting overwhelmed by it.
This provides researchers with access to an empirical foundation that would previously have required greater resources to establish, and gives research projects the flexibility to utilize both qualitative and quantitative methods.

Education and Learning
Involve opens the door to a new type of learning data: Rather than measuring what students can remember or reproduce, it allows you to collect their own reflections, experiences, and insights in open formats and over time.
This gives educators and institutions a much richer picture of how learning actually takes place, where understanding is solid, and where it is evolving—in ways that closed evaluation formats would never reveal.

International projects
With multilingual transcription technology, Involve can support transnational projects across countries and languages. This makes it possible to run scalable, structured dialogue processes with participants in multicultural cities, or with participants from many different national contexts, while still producing comparable, analyzable data at the end.
A tool rooted in research
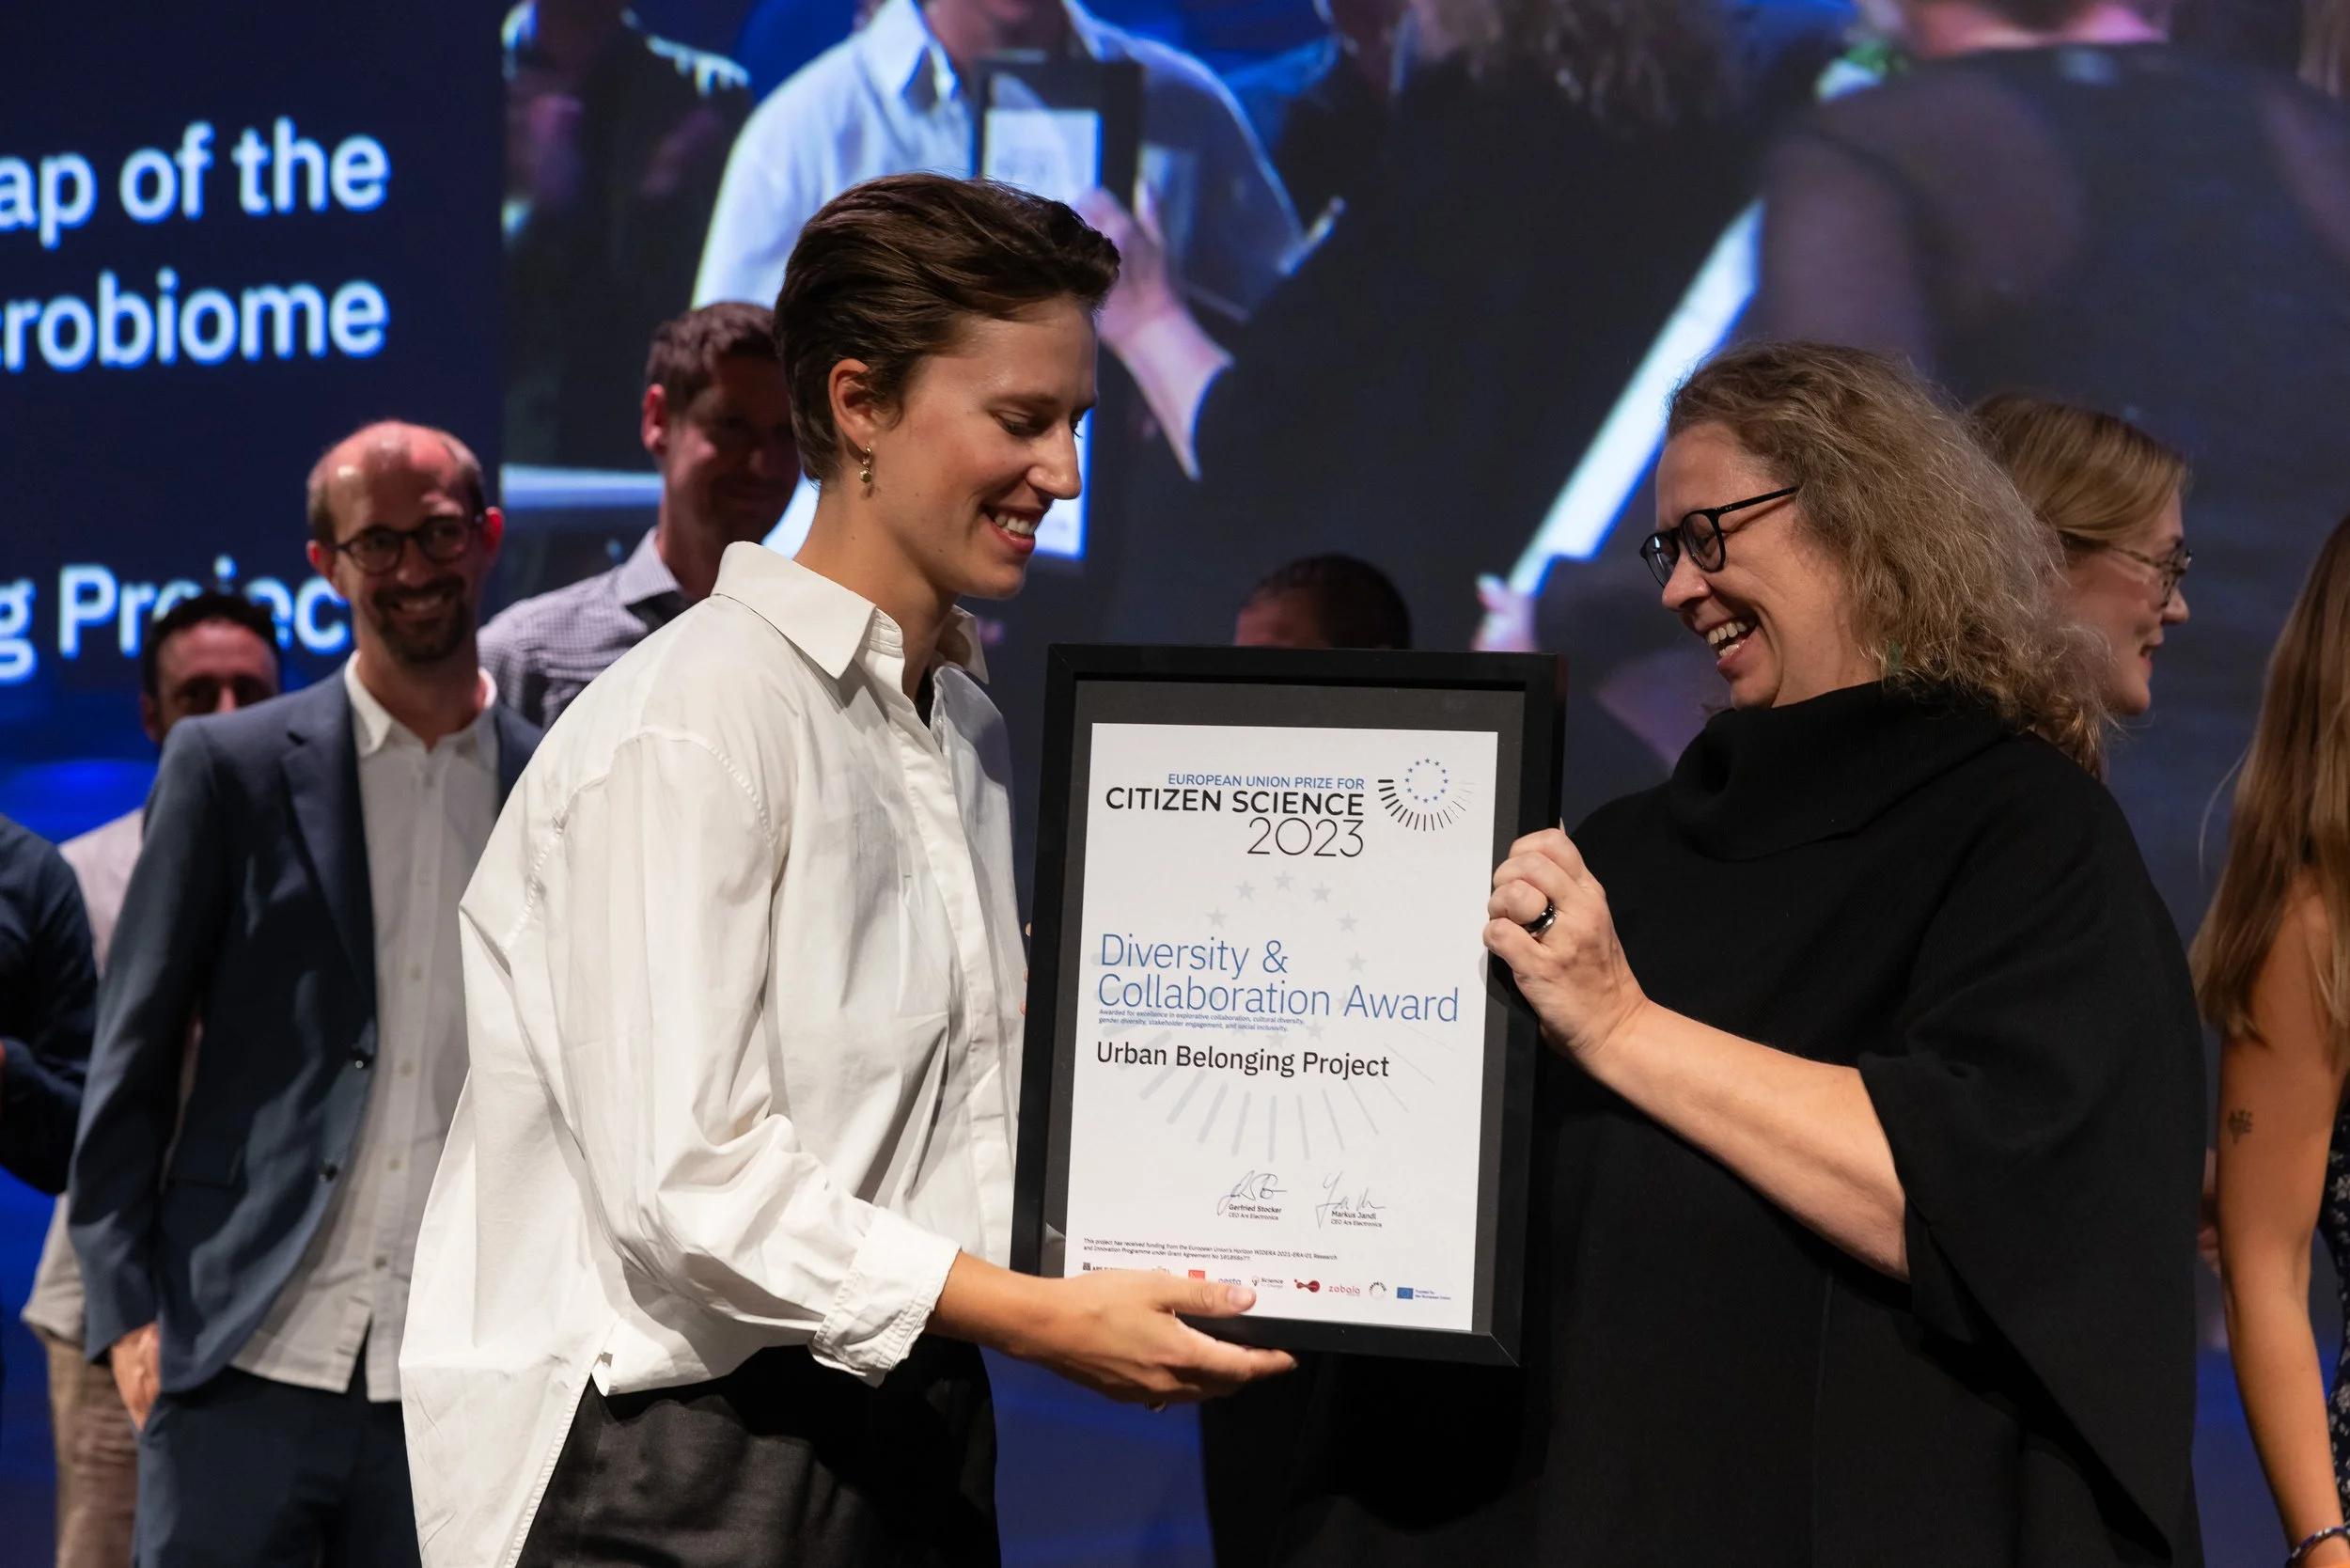
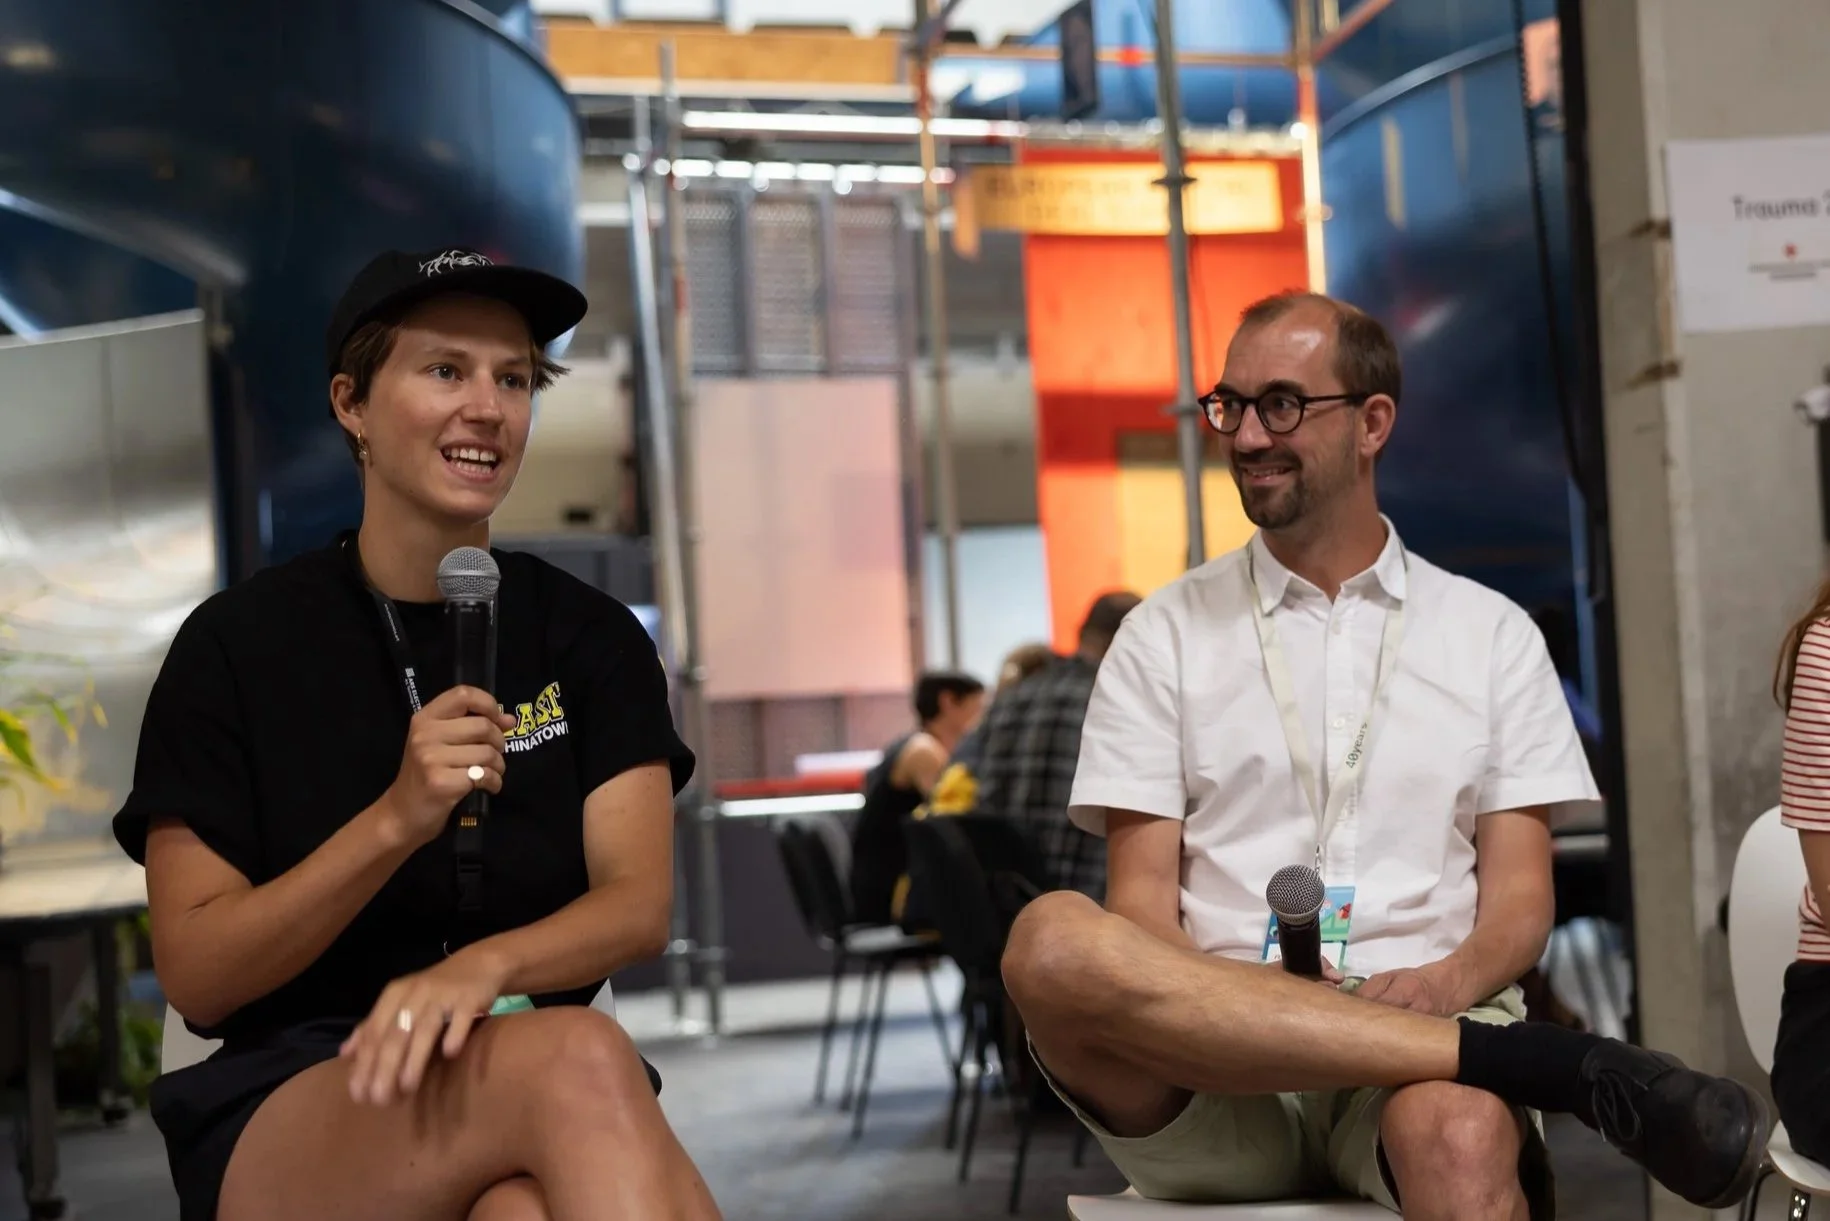
Involve was developed based on open-source research and development from the Urban Belonging Project, led by INVI’s Head of Research and Analysis, Sofie Burgos-Thorsen, during her time as a researcher at Aalborg University in collaboration with Professor Anders Koed Madsen (DTU) and partners from both the research and business communities.
From urban research to broad-based democratic innovation
The Urban Belonging App, launched in 2022, was among the first digital tools in urban research and urban planning to rethink data collection and citizen engagement by using mobile technologies to enable large-scale qualitative, multi-modal data collection with user-generated data labeling. The development and use of the app in a research context have been described in several peer-reviewed scientific articles, and Sofie, Anders, and the rest of the team received the EU Citizen Science Award in 2023 for their work.
Involve builds on this foundation but has expanded the app’s capabilities in key areas, making it even more effective at engaging users and mapping collective knowledge.
Part of INVI’s mission
The app is part of INVI’s mission as a think tank to foster democratic innovation and develop tools for addressing wicked ” of the 21st century. It was created primarily to ensure that more people can contribute their knowledge, experiences, and hopes regarding how society addresses complexwicked .” The app does this, among other things, by enabling the systematic collection and analysis of qualitative data on a large scale—directly from citizens and practitioners.
An open-source ecosystem
We are proud to contribute to the development of open-source research tools in Denmark. Although the entire Involve codebase is not publicly available, we actively contribute to the Urban Belonging ecosystem when new features or improvements have broader public value. As a result, the technologies and features we invest in developing often benefit others as well.

How do you get started?
If you’re curious about Involve, want to see how it works, or would like to use it for a specific project, please contact us and let us know what you need. We’d be happy to give you a demo of the tool so you can try it out for yourself, and tell you more about how you can use it.