

Model for Wicked Problems
Helps decision-makers navigate complexity
The "Model for wicked is an AI-ethnographic method developed by INVI to map collective knowledge from citizens, practitioners, and stakeholders regarding complex challenges using large-scale qualitative data.
Are you interested in collaborating with us—whether in a research context or on a specific project? Write to us and tell us about the journey of change you’re on, or what your challenges and needs are.

The world's first model for measuring wildness
Denmark faces a number of social problems that have been recognized, attempts have been made to solve them, and yet they remain unresolved. The climate crisis. The unhappiness of children and young people. The labor shortage. What they have in common is that they are complex: there is deep disagreement about causes and solutions, they are difficult to define across sectors and administrative levels, and they are linked to political polarization. But our society has not had an analytical tool to systematically measure the complexity and track developments in such wicked . Until now.
The wicked Model was created to enable the mapping and navigation of difficult societal challenges and complex problems. The model is the world’s first digital analytical tool capable of measuring societal problems on a scale from tame to wild, and continuously translating large amounts of qualitative input into empirical data that can be used directly in political and organizational decision-making contexts.
The model serves as a data-driven compass. By quantifying a problem based on the range of ideas regarding causes and solutions, the number of sectors involved, and the level of conflict, we can:
Understand why some problems are difficult to deal with
Compare the complexity of different problems
Track how the nature of a problem evolves over time
Wildness measured across four dimensions
Every problem is different, and we always tailor our analyses to the context. But when we need to compare wicked or track the evolution of a problem over time, we typically examine them across four dimensions that the academic literature has shown to be strong indicators of how complex a societal problem is. We use language models and statistical techniques to create a scale from 0 to 100 measuring how “wicked” a given problem is on each of the four dimensions, and can ultimately combine the metrics into a single overall measure of the problem’s wickedness.
-
What causes do various stakeholders point to? Do citizens, practitioners, and stakeholders across professional groups, sectors, and demographics agree on why the problem persists—or is there doubt and disagreement?
-
What solutions are various stakeholders proposing? Do citizens, practitioners, and stakeholders across professional groups, sectors, and demographics agree on which solutions we should adopt—or are the proposed solutions varied and fraught with uncertainty?
-
Which sectors and political-administrative levels are identified as relevant? And where do we see a mutual versus a unilateral understanding of who should collaborate to solve the problem?
-
How polarized is the issue? What differences exist among stakeholder groups regarding the importance of taking action—and how do they speak about one another?
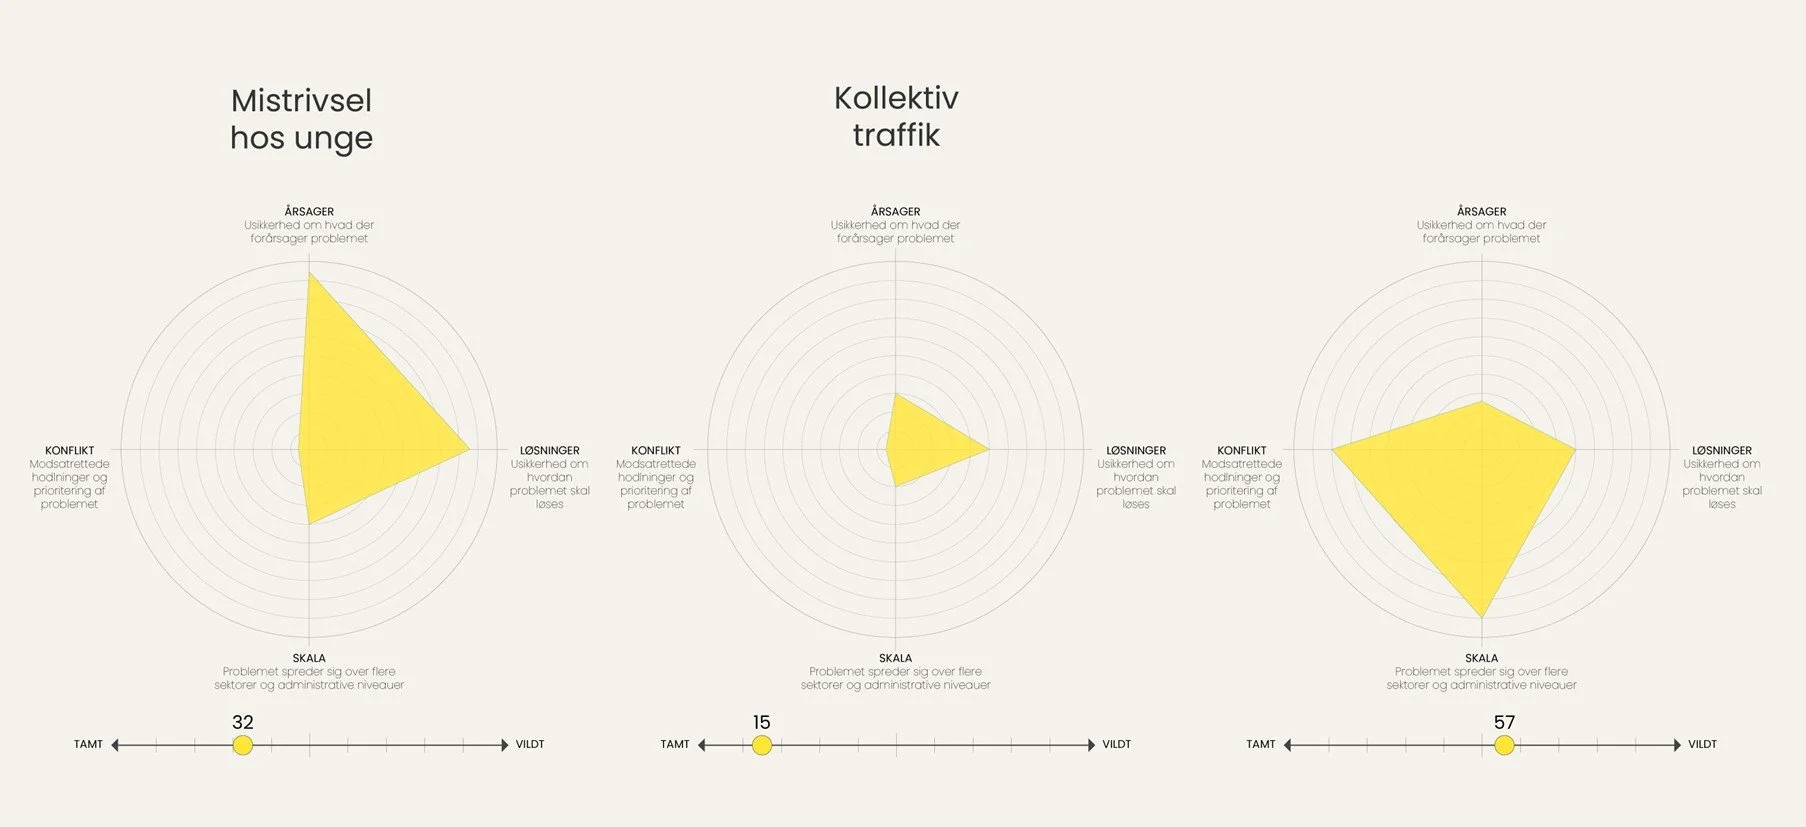
Different types of challenges call for different solutions. Quantifying the problems therefore gives decision-makers a clearer idea of how to act. Take three different problems as examples: public transportation, employee dissatisfaction, and climate change. Public transportation is relatively straightforward. We know what the problem is, and we have known solutions. Here, we can do what we usually do. Unhappiness is more complex: The causes are debated, and proposed solutions diverge in many directions. This calls for pilot projects and deeper work to uncover and agree on the roots of the problem. Climate change is even more complex. Not just because it’s complex, but because it’s also deeply contentious and involves stakeholders across many sectors and levels. Here, “business as usual” won’t work. We need solutions that can unite many stakeholders around common goals.
The model provides a shared framework to guide us
Analyses that untie the Gordian knot
From quantitative trends to qualitative nuances
Measuring the complexity of problems is just one of the model’s applications. In practice, INVI uses the model as an AI-ethnographic analysis tool; a semi-automated method that, through advanced language models, clustering techniques, and statistical calculations, can structure large volumes of qualitative text and identify which understandings recur across stakeholder groups, which are specific to certain groups, and which stand out. The AI handles the complexity; INVI’s analysts interpret the data.
This isn’t mixed methods, where quantitative and qualitative data are separated and then combined. It’s a new kind of knowledge: quantitative trends and qualitative depth drawn from a single dataset, creating emergent insights. Unlike survey data, we don’t just confirm what we already assumed. Instead, we start with people’s own words to explore what matters to them. Emerging insights that open the door to new knowledge and reveal the limitations of established explanatory models.
This opens the door to a wide range of applications. From mapping an organization’s strategic landscape; to tracking how a reform plays out in practice; to measuring whether an initiative actually shifts perspectives over time. The model creates a data-driven compass you can navigate by—whether you’re in the midst of a political regulatory challenge, an organizational change process, or a conflict-ridden stakeholder landscape.
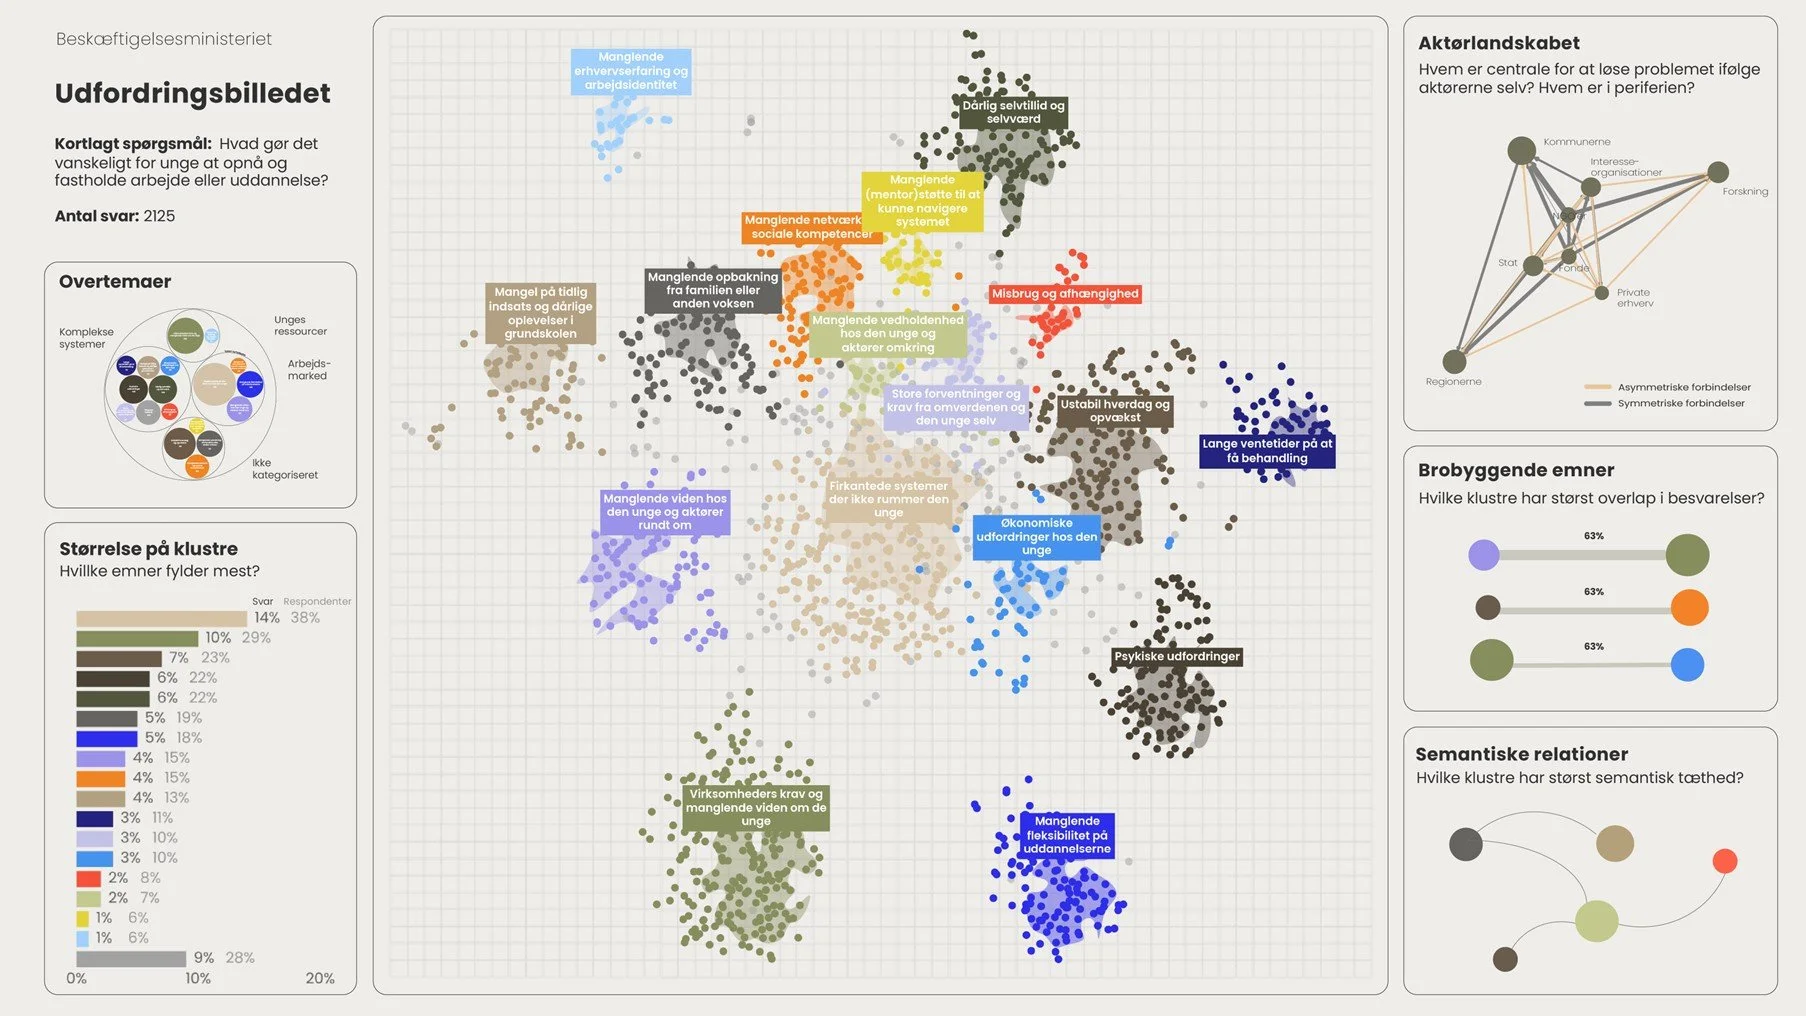
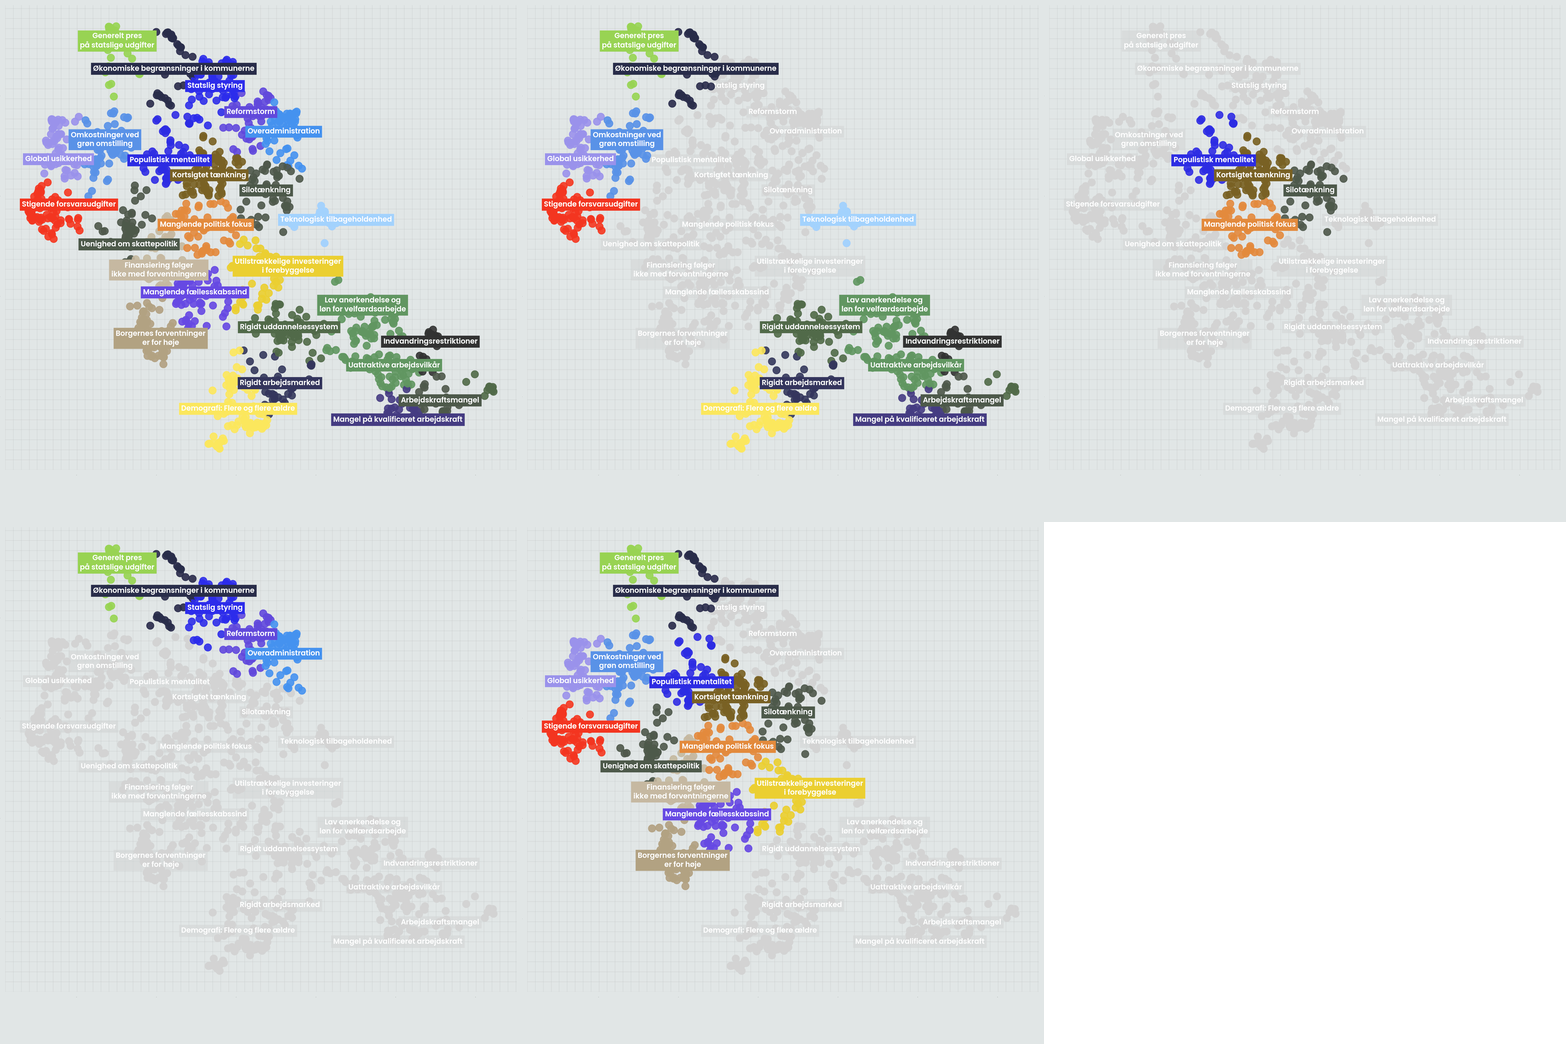
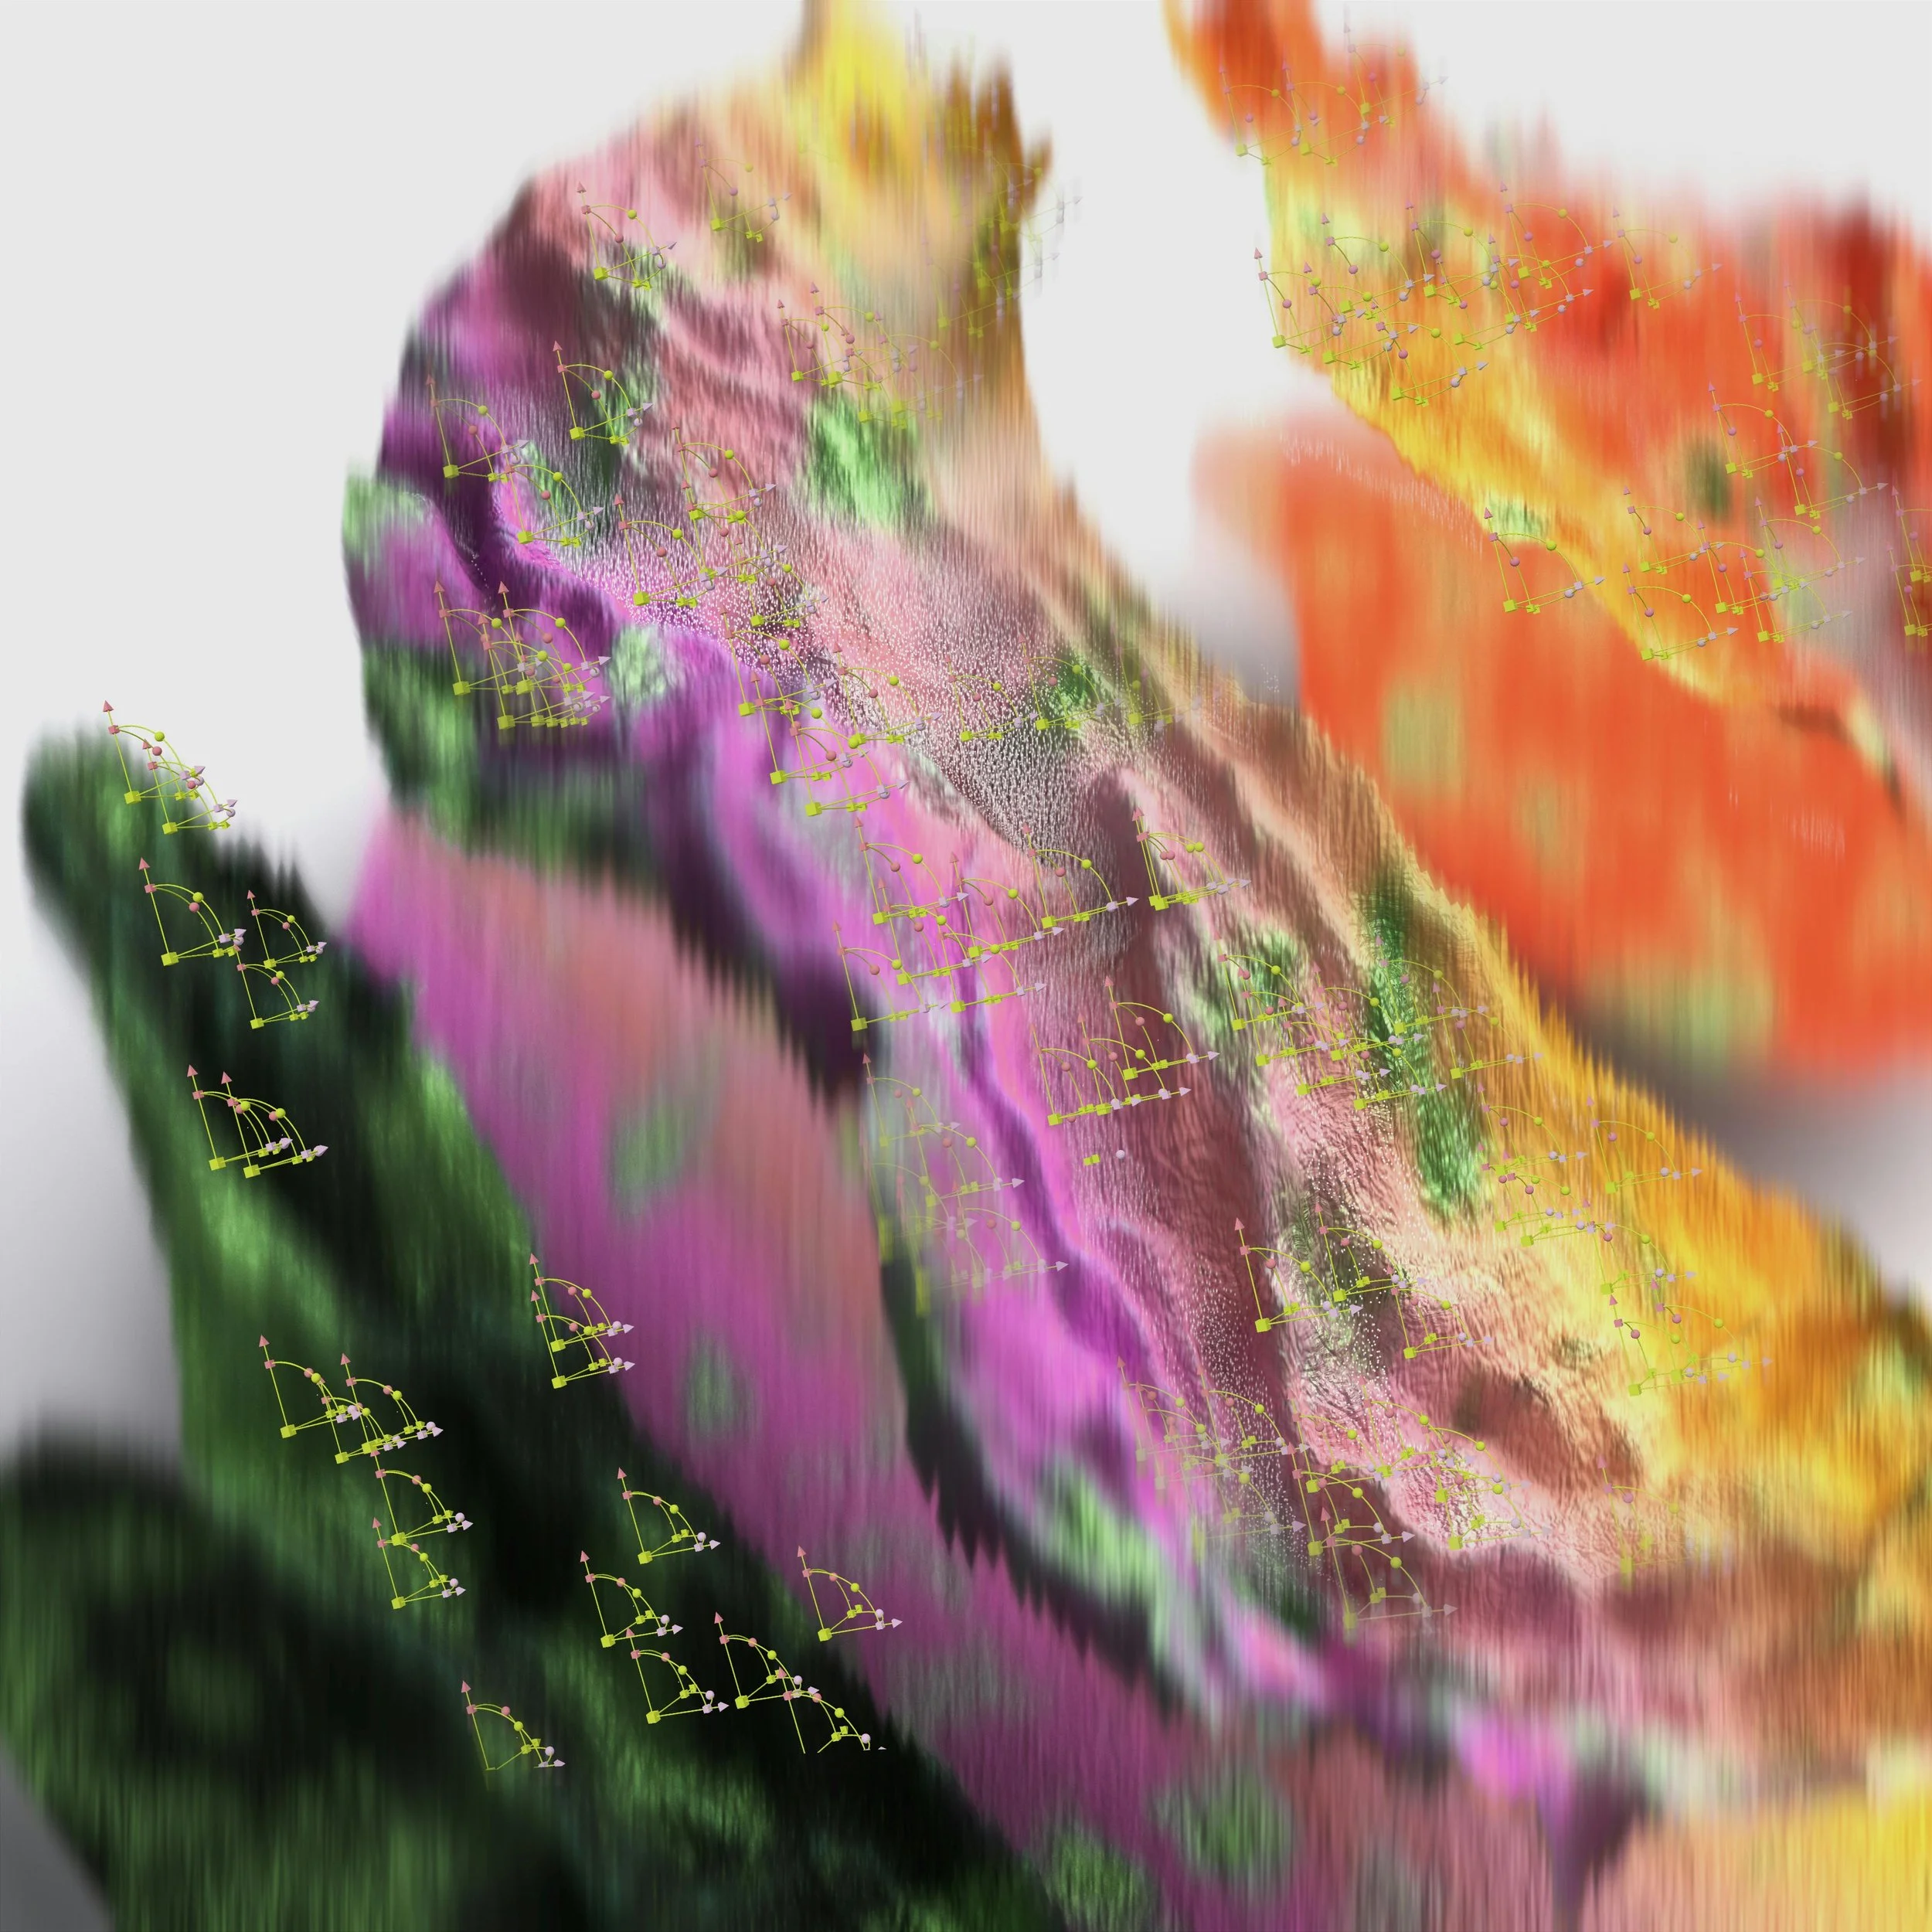
Example of a visualization of data collected for STAR and the Ministry of Employment in connection with INVI’s study of the Ungeløftet initiative. More than 2,000 qualitative responses were gathered from over 800 different practitioners to highlight the many different perspectives on the issue of the Potential Group.
Here’s how we use the model to drive change
We apply the wicked Model in policy and strategy work across four phases.
-
What exactly is the problem? The " wicked " model helps clarify complex problem areas by mapping out how the problem is understood across different stakeholder groups: what defines it, what causes it, and when does it arise?
Example: Together with the Danish Association of Architects and Danske Arkitekter, we explored how design competitions can be reimagined in relation to the green transition. We did this by surveying the views of clients, procurement lawyers, consultants, and architects on design competitions in their current form. You can read more about this specific project here.
-
How can we ensure that decisions are made on an informed basis? The model provides a clear picture of the solutions that exist within the collective knowledge across a diverse landscape of stakeholders—what has broad support, what is prevalent in specific groups, and what is based on concrete experiences.
Example: In 2025, we assisted the Danish Cancer Society in developing a new strategy. By collecting and analyzing input from the organization’s volunteers, members, employees, patients, and their families, the model helped ensure that the strategy was grounded in the relevant groups’ perspectives on the Danish Cancer Society’s current and future work. You can read more about the specific project here.
-
How do you know if a new policy or initiative is working as intended? We use the model to gain ongoing insight into how initiatives are experienced in practice, and to give citizens and practitioners a direct channel of communication with decision-makers. This can be done from day one of implementation or after two years, once daily life has changed.
Example: For the Ministry of Senior Citizens, we are helping to examine how the implementation of the Senior Citizens Reform (2025) is perceived across all parts of the implementation chain—from state and municipal officials to professionals in elder care, and to the elderly themselves and their relatives. For the Ministry of Employment and the Danish Agency for Labor Market and Recruitment, we are monitoring how the implementation of the Youth Initiative (2025) is driving change among, among others, municipal officials, case workers, educators, and the young people themselves.
You can view the project on the Elderly Care Reform here and by Ungeløftet here.
-
How can we measure impact beyond rigid metrics? The model can be used as an alternative to or in conjunction with traditional KPIs to gain deeper insights into the actual impact of initiatives, and shows, for example, how the discourse surrounding a concept or the perception of a phenomenon has changed over time.
Example: In collaboration with the Bikube Foundation, we are examining how stakeholders in the child welfare sector view the future of youth placement in Denmark. Through repeated assessments of stakeholders’ frustrations, aspirations, and perspectives on collaboration, we are measuring how their scope for action expands in tandem with the Bikube Foundation’s work with the stakeholder group. View the project here.
In 2026, we are helping the UK-based Henry Smith Foundation rethink its approach to impact measurement by compiling the qualitative information that grant recipients report annually in their applications and progress reports, but which is currently not analyzed systematically. You can view the project here.
Engine room
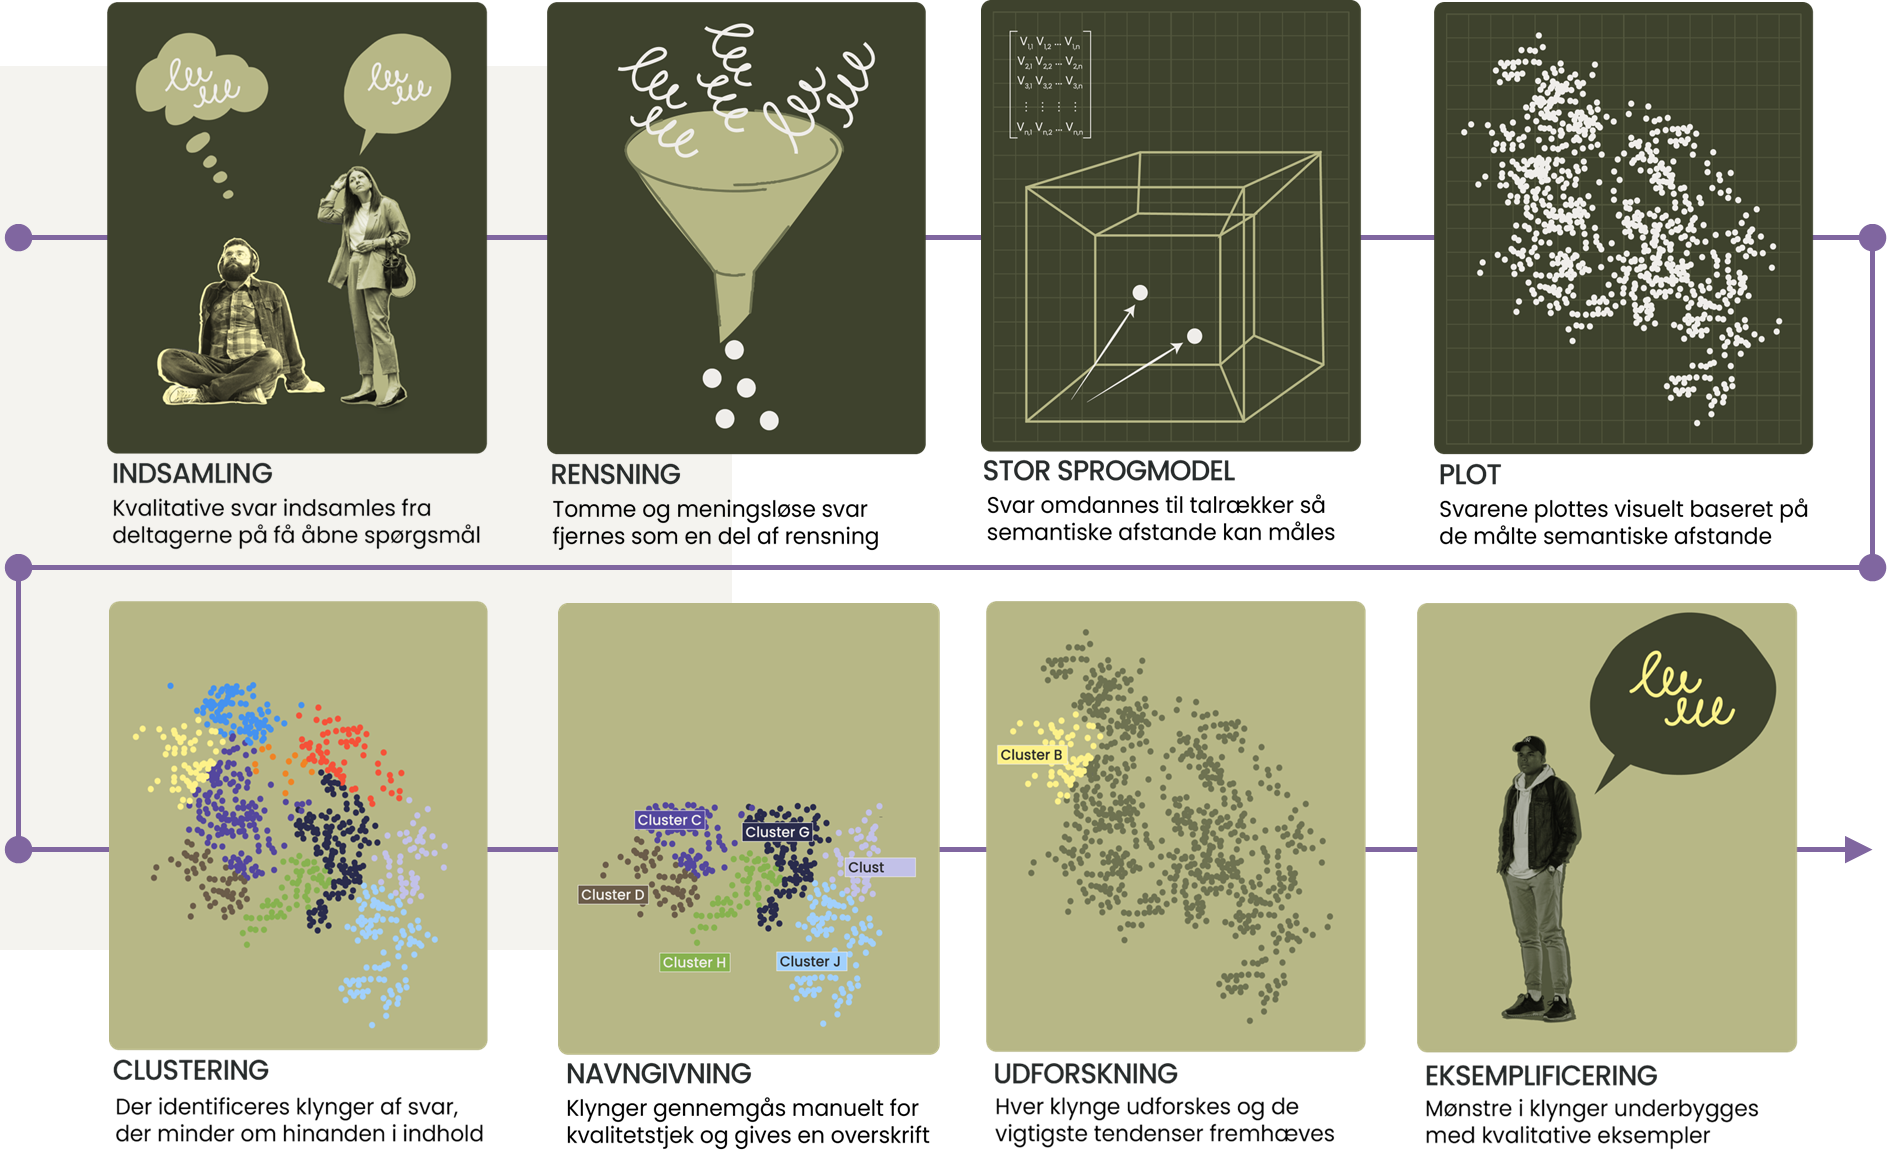
The " wicked " model was created to address a well-known dilemma in democratic participation: the choice between collecting data on a small scale with depth, or on a large scale using closed, predetermined categories. With language technologies and computational tools, it is now possible to analyze and categorize thousands of freely formulated inputs without compromising on volume or depth. With the Model for wicked , we have created a tool that we can use to process qualitative data on a large scale—both with an eye toward identifying overarching patterns, trends, and group distinctions at the quantitative level, and with an eye for important qualitative nuances in the data.
This enables us to move freely between the big picture and the individual voices behind it—and to introduce rich, qualitative data into a political system that is otherwise geared toward either surveys with predetermined problem definitions or qualitative interviews that, at best, are treated as anecdotes.
-
At the core of the model are word embeddings —a technology in which each qualitative statement is converted into a vector in a high-dimensional semantic space. This means that the meaning of the statements can be measured and compared mathematically: the closer two statements are in the semantic space, the more similar they are in content. Using advanced clustering techniques, the model groups statements with semantic similarity and identifies which understandings recur across stakeholder groups, which are specific to certain groups, and which stand out. While identifying clusters in the data, we also use embedding models to create empirical measures of how scattered the understandings of a problem are. The more diverse the stakeholders’ discussions of the problem, the higher the dispersion score. If they converge on shared understandings, we measure the problem as less dispersed.
In other words, AI is not merely infrastructure that streamlines something we were already capable of doing. It enables an analytical tool that could not have existed at all before the advent of large language models. However, the model does not produce conclusions —it produces patterns. The analysis is always interpreted by INVI’s analysts and is based on professional assessments and contextual knowledge of the domain. Responsibility cannot be delegated to an algorithm.
-
The model for wicked uses qualitative data as input. This opens up a wide range of applications, where the only limit is one’s imagination. We typically distinguish between qualitative data created specifically for a project and qualitative data that already exists but has not yet been utilized for systematic analysis.
The data generated consists (as a general rule) of qualitative data collected as part of the study. In collaboration with experts and professionals, a stakeholder base and composition are established, along with a set of open-ended questions that form the foundation of the study. Most often, data is collected as free-text responses, where participants are not limited to predefined, closed-ended response categories but can define their own answers.
At INVI, we have developed our own infrastructure for large-scale qualitative data collection: the Involve app, which makes it easy and engaging to gather input directly from people. Participants can answer open-ended questions using text, images, and audio recordings, which are automatically transcribed, and we can ask people to annotate their own responses and react to others’ input, so we get data with depth and context.
Learn more about Involve here.
The data available encompasses all digital qualitative data sources, whether publicly accessible or stored internally within an organization. Perhaps it would be interesting to examine how parliamentary debate on a specific topic has evolved over time? Or to map trends in scientific research articles regarding a particular phenomenon. It may also be the case that a foundation or NGO has archives of documents such as applications, minutes, interviews, or speeches that it wishes to examine systematically to learn something new about issues that are difficult to answer using conventional data sources.
1. Input
We map collective knowledge across a diverse range of stakeholders and identify patterns.
2. Insight
We translate the patterns and nuances we see in the data into relevant insights.
3. Initiative
We translate insights into concrete initiatives that chart a new course forward in addressing the issue.
Input, Insight, Initiative
INVI uses the wicked Model to transform qualitative data from citizens, practitioners, and stakeholders into strategically grounded insights that generate new perspectives, deepen understanding of the problem, and provide a shared direction for action and concrete initiatives.
Combined with INVI’s ATLAS—a collection of creative policy and strategy tools—we translate insights into concrete initiatives tailored specifically to the problem you’re facing. From pilot projects and scenario-based processes to mission-driven work and modular co-creation. ATLAS matches the relevant solutions to the specific problem, based on what the mapping has revealed about why the problem is complex.
Development
Research Collaborations
Since its launch in 2024, when INVI presented the solution to the Minister of Finance at Christiansborg, we have been exploring the use of AI in the model in relation to challenges surrounding bias and fairness. It is important for INVI to understand how AI shapes our results so that we can critically evaluate our findings and counteract any potential distortions and biases—from the moment we collect data through to processing, analyzing, and disseminating it. That is why we actively engage in collaborations with relevant research communities both within and outside Denmark, participate in conferences, and document our methodological work in scientific articles. You can read more about this below. Read more about INVI’s work on ethics in relation to AI and the development of tools here.
-
![]()
ETHOS Lab at ITU
EthosLab at the IT University of Copenhagen conducts feminist and critical technology research. In collaboration with EthosLab, INVI organized a four-session workshop series, inviting external researchers, practitioners, and students to work directly with our data and case studies and challenge our approach to ethics. The focus was on bias in data, AI aesthetics, data visualization, and translating ethical principles into operational playbooks. The sessions helped us challenge our approaches to ensure that we do not develop blind spots.
-
![]()
Oxford Internet Institute
The OII at the University of Oxford in the UK is one of the world’s leading research centers on the social and political implications of the internet. In collaboration with the OII, we have investigated and tested fairness issues in the embedding models that form the basis of INVI’s Model for wicked —and we are in the process of publishing the results as a peer-reviewed article. The collaboration has focused on evaluating, based on INVI’s dataset, how well over 40 different embedding models process inputs from various citizen groups.
-
![]()
MIT & Northeastern
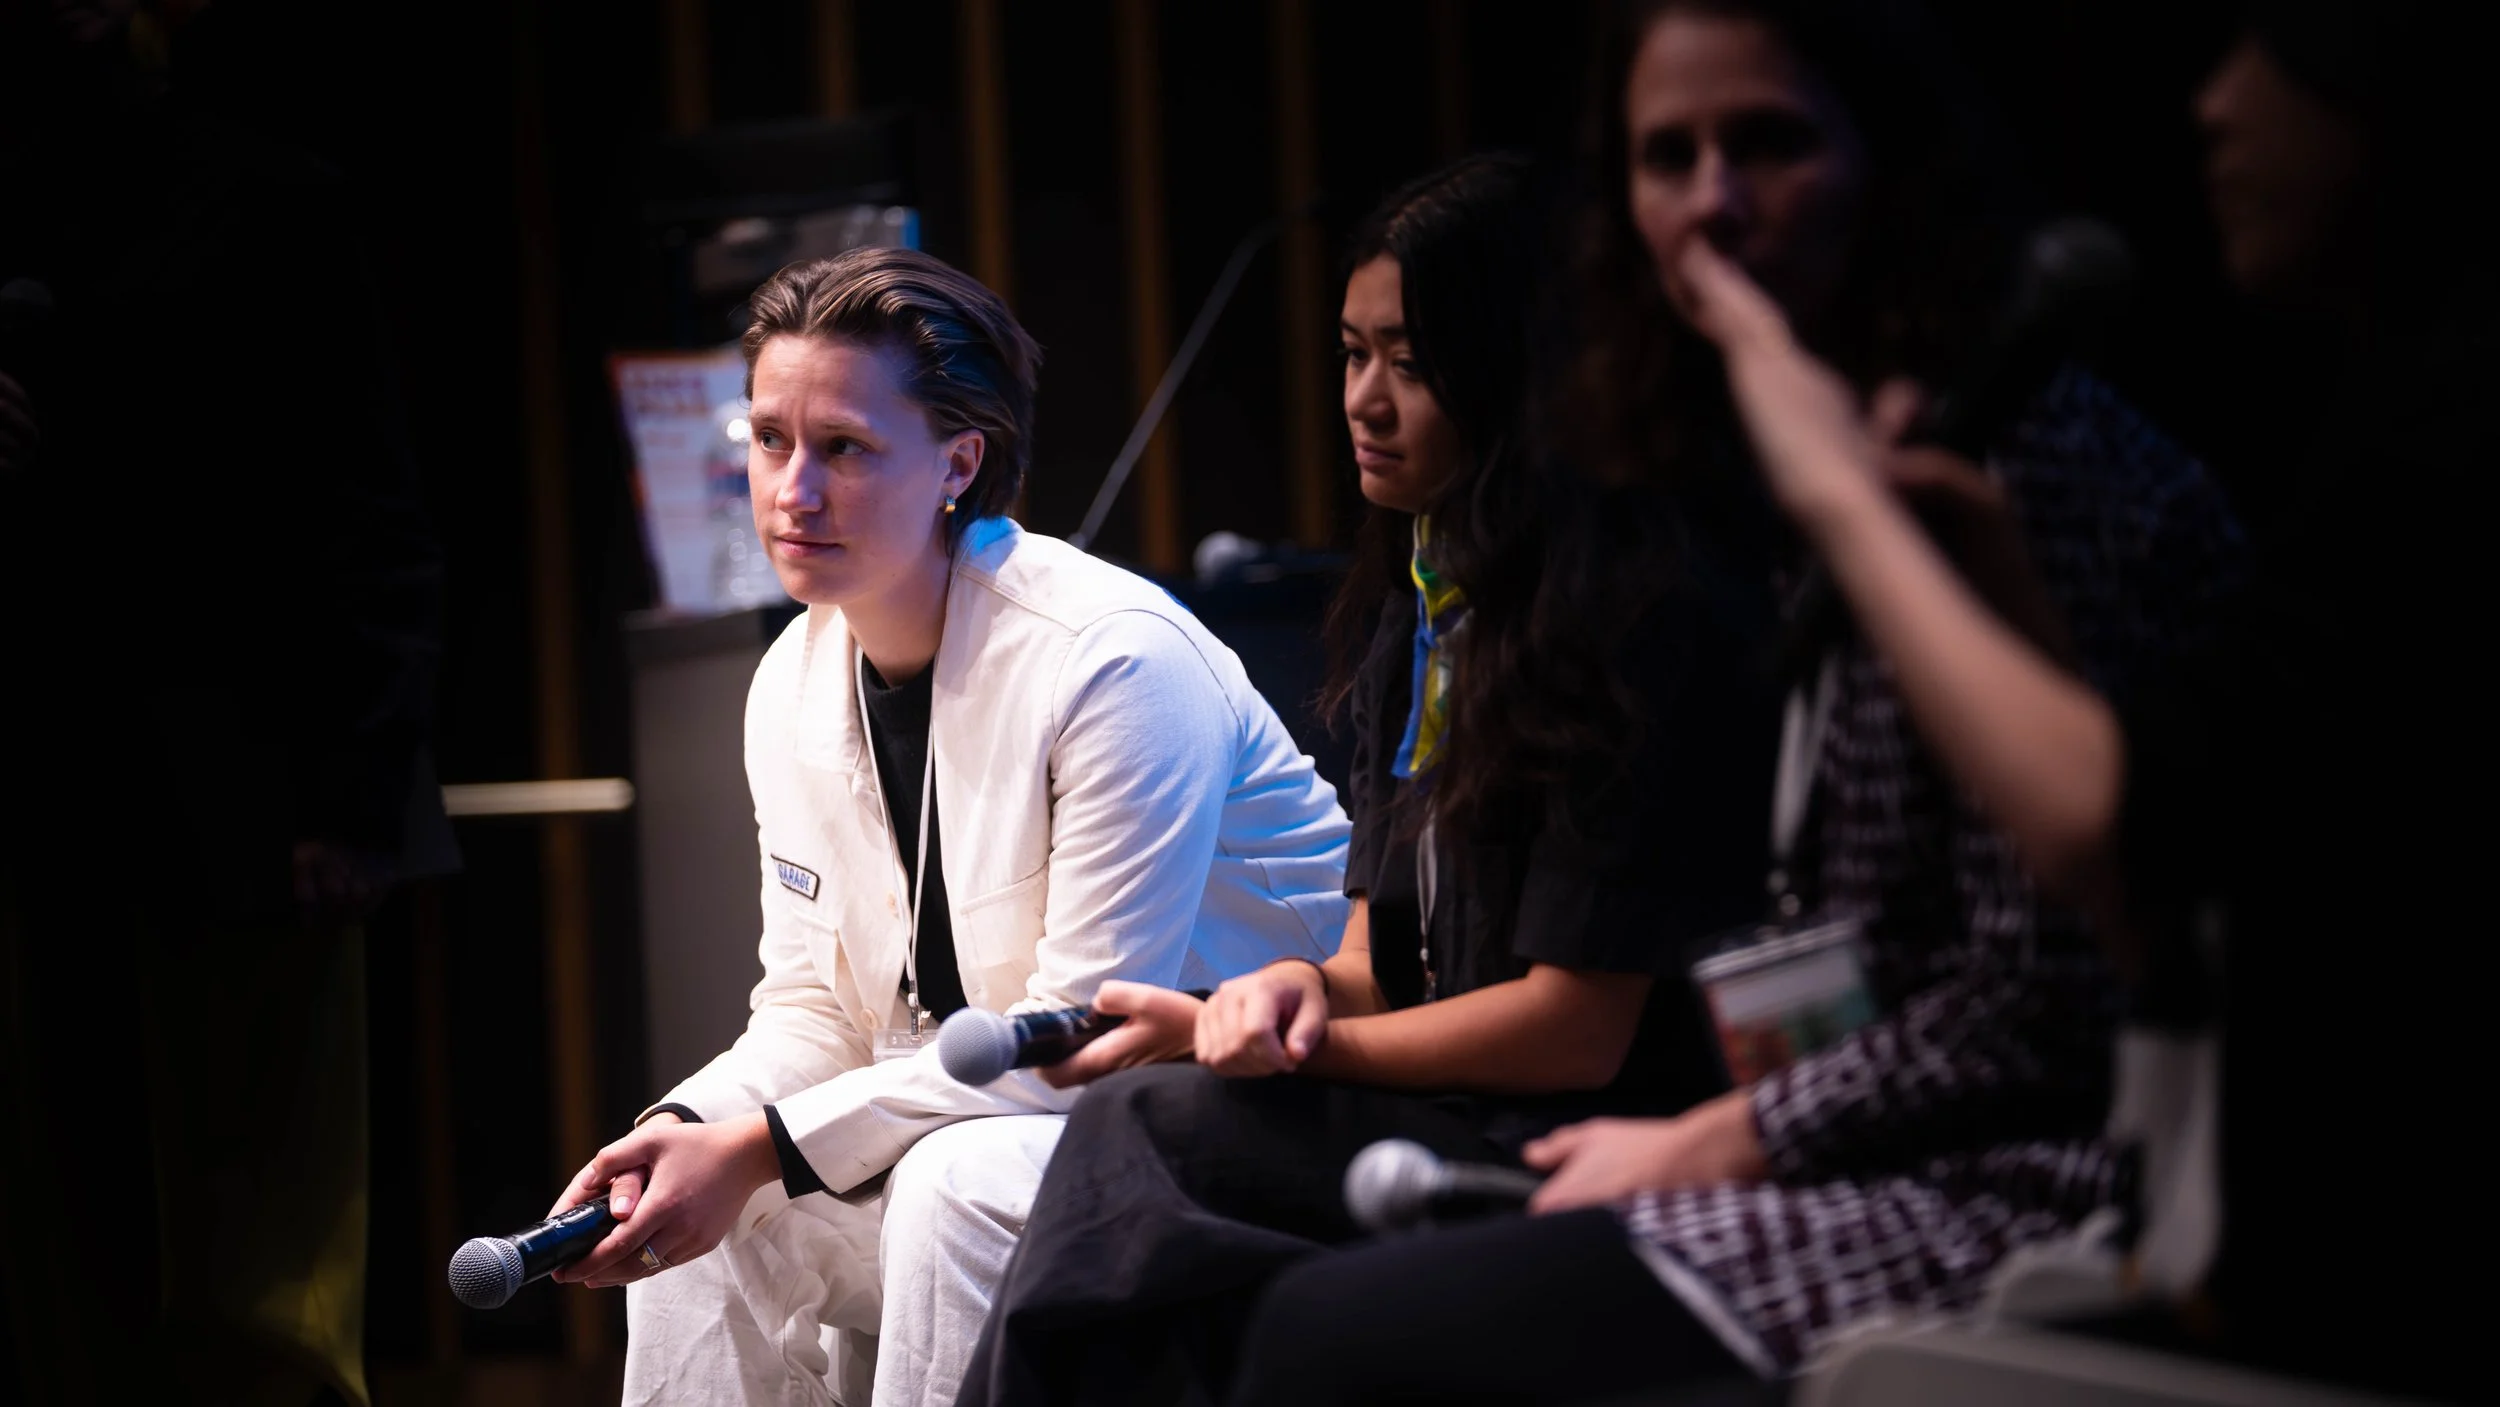
In 2025, INVI’s chief analyst, Sofie Burgos-Thorsen, attended Information+ at MIT and Northeastern University in Boston, one of the leading conferences in data visualization and information design. Sofie gave a talk on feminist data visualization, participated in the panel “Visualization and Feminism,” moderated by Catherine D’Ignazio from MIT, and took part in workshops with other researchers and practitioners. The visit brought state-of-the-art knowledge back to INVI, informing how we communicate complex societal issues through data.
-
![]()
ECHO Lab at DTU
ECHO Lab at the Technical University of Denmark focuses on digital, AI-driven anthropology and social analysis. Professor Anders Kristian Munk has served as a special advisor to INVI and has collaborated with us to ensure that our use of language models is methodologically sound and at the forefront of the field. The collaboration has focused on gaining a clear understanding of how the language models we use process data—so that we can interpret and contextualize our analysis results with credibility and transparency.
-
![]()
AI and Rhetoric Research
In 2025, INVI entered into a thesis collaboration with rhetoric student Mette Susgaard from Aarhus University. Using critical discourse analysis as a framework, Mette examined how artificial intelligence is framed in policy documents and speculative fiction—and what rhetorical challenges this poses for an organization like INVI. The thesis specifically analyzed INVI’s communication regarding the Model for wicked and offered new perspectives on how we communicate about the responsible use of AI, so that we can combat myths and techno-utopian framing.
-
![]()
Harvard metaLAB
In 2025, INVI’s chief analyst, Sofie Burgos-Thorsen, participated in the Data | Art Symposium, co-hosted by metaLAB at Harvard University and BarabasiLab. The symposium brings together researchers, artists, and designers at the intersection of data science and aesthetic practice. For INVI, it was a valuable opportunity to engage in dialogue with the world’s leading researchers in data visualization on a question central to our work: how to visualize the complexity wicked in accessible ways.
Follow-up group
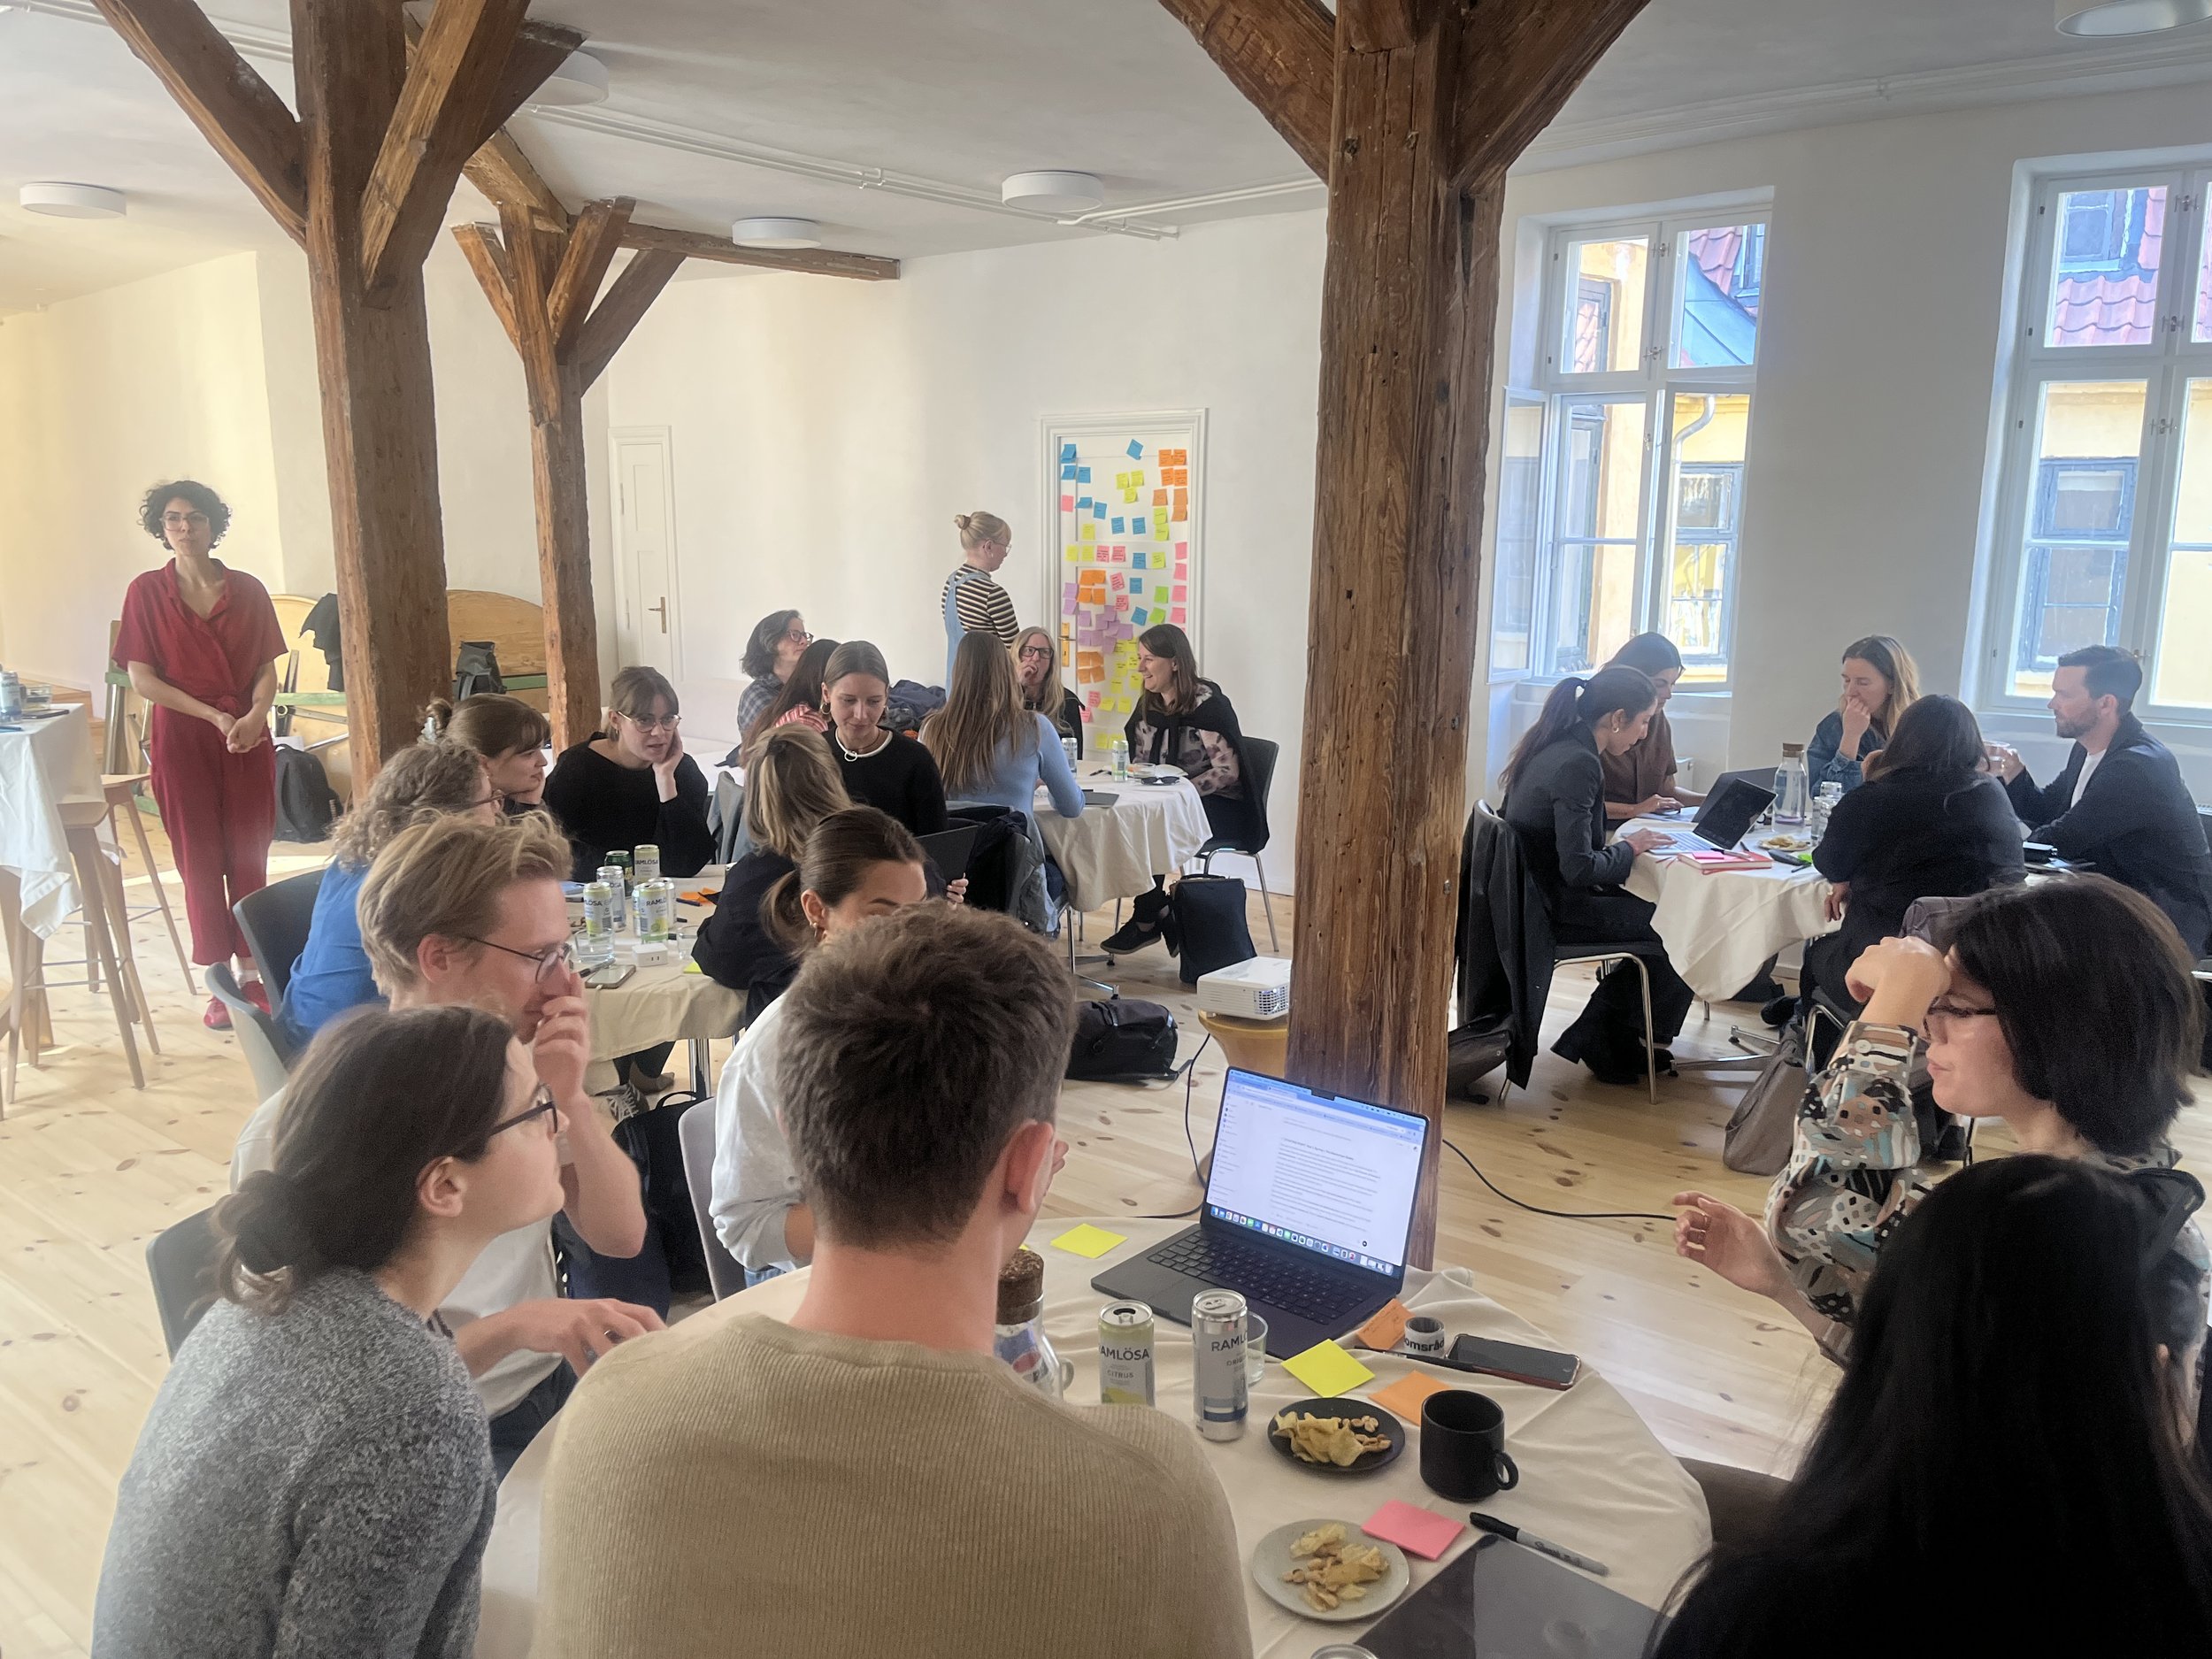
The model for wicked was originally developed in collaboration with Professor Jacob Hariri (University of Copenhagen) and Anders Kristian Munk (Technical University of Denmark) and has been quality-assured by an advisory group consisting of researchers and senior leaders from politics, business, and civil society to ensure its relevance and applicability across sectors.
-
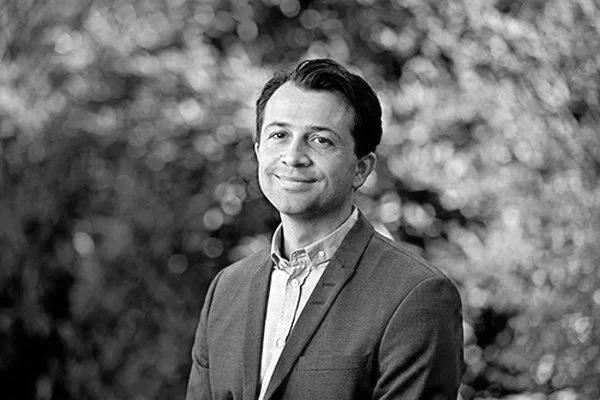
Jacob Gerner Hariri
Professor of Political Science, University of Copenhagen
-
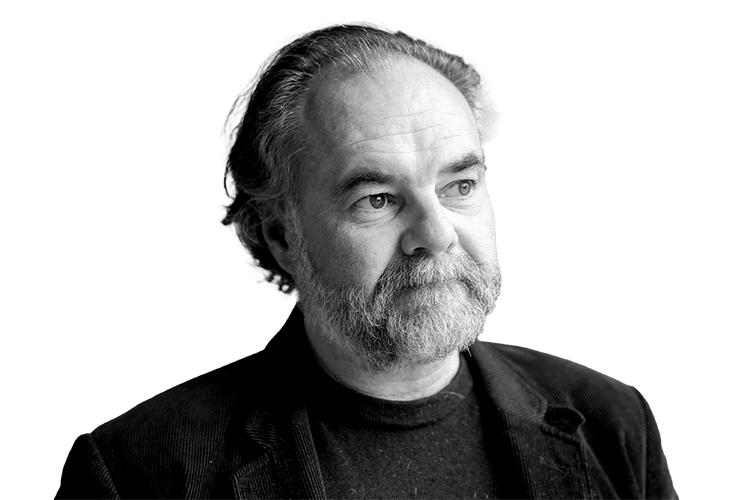
Carl-Johan Dalgaard
, Chair of the Economic Council; Professor, University of Copenhagen -
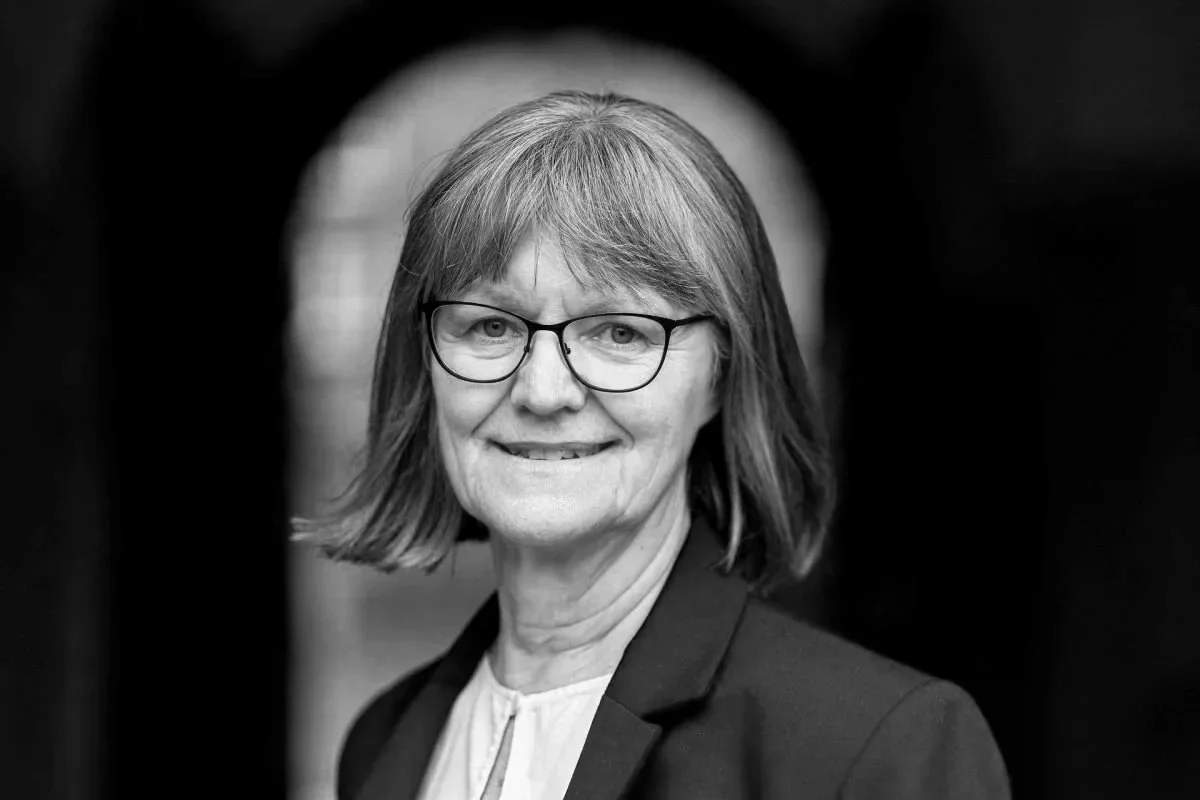
Nina Smith
Professor, Department of Economics, Aarhus University
-
Peter Stensgaard Mørch
Managing Director, PensionDanmark
-
Maj Baltzarsen
Deputy Director, Brundtland Institute
-
Michael Bang Petersen
Professor of Political Science, Aarhus University. Chair of the Power Inquiry.
-
Kira West
Director of the "
" (Home for All) Alliance -
Anders Kristian Munk
Professor of Computational Anthropology, DTU
Mention
Monday Morning
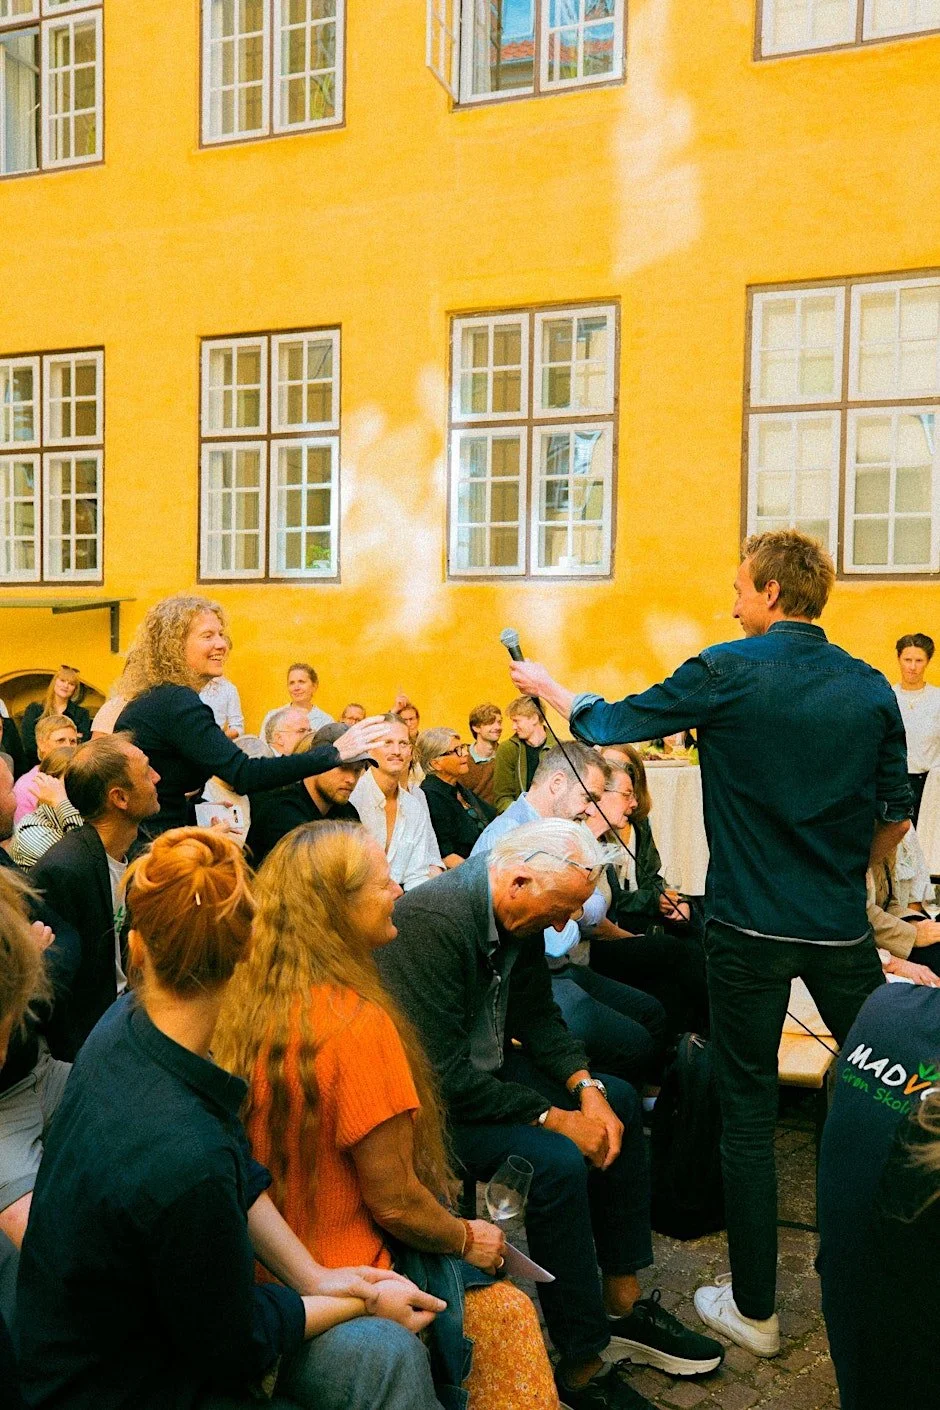
“Sigge Winther is set to introduce a new model for tackling wicked .”
Read the article here.

Berlingske
“His analysis of Danish politics has been closely studied at Slotsholmen—now the government is doing exactly what he has advocated.”
Read the article here.

The Stock Exchange
“Frustrated CEO sounded the alarm over a deep crisis in Danish politics—now he’s offering his solution.”
Read the article here.
Public hearing at the Parliament
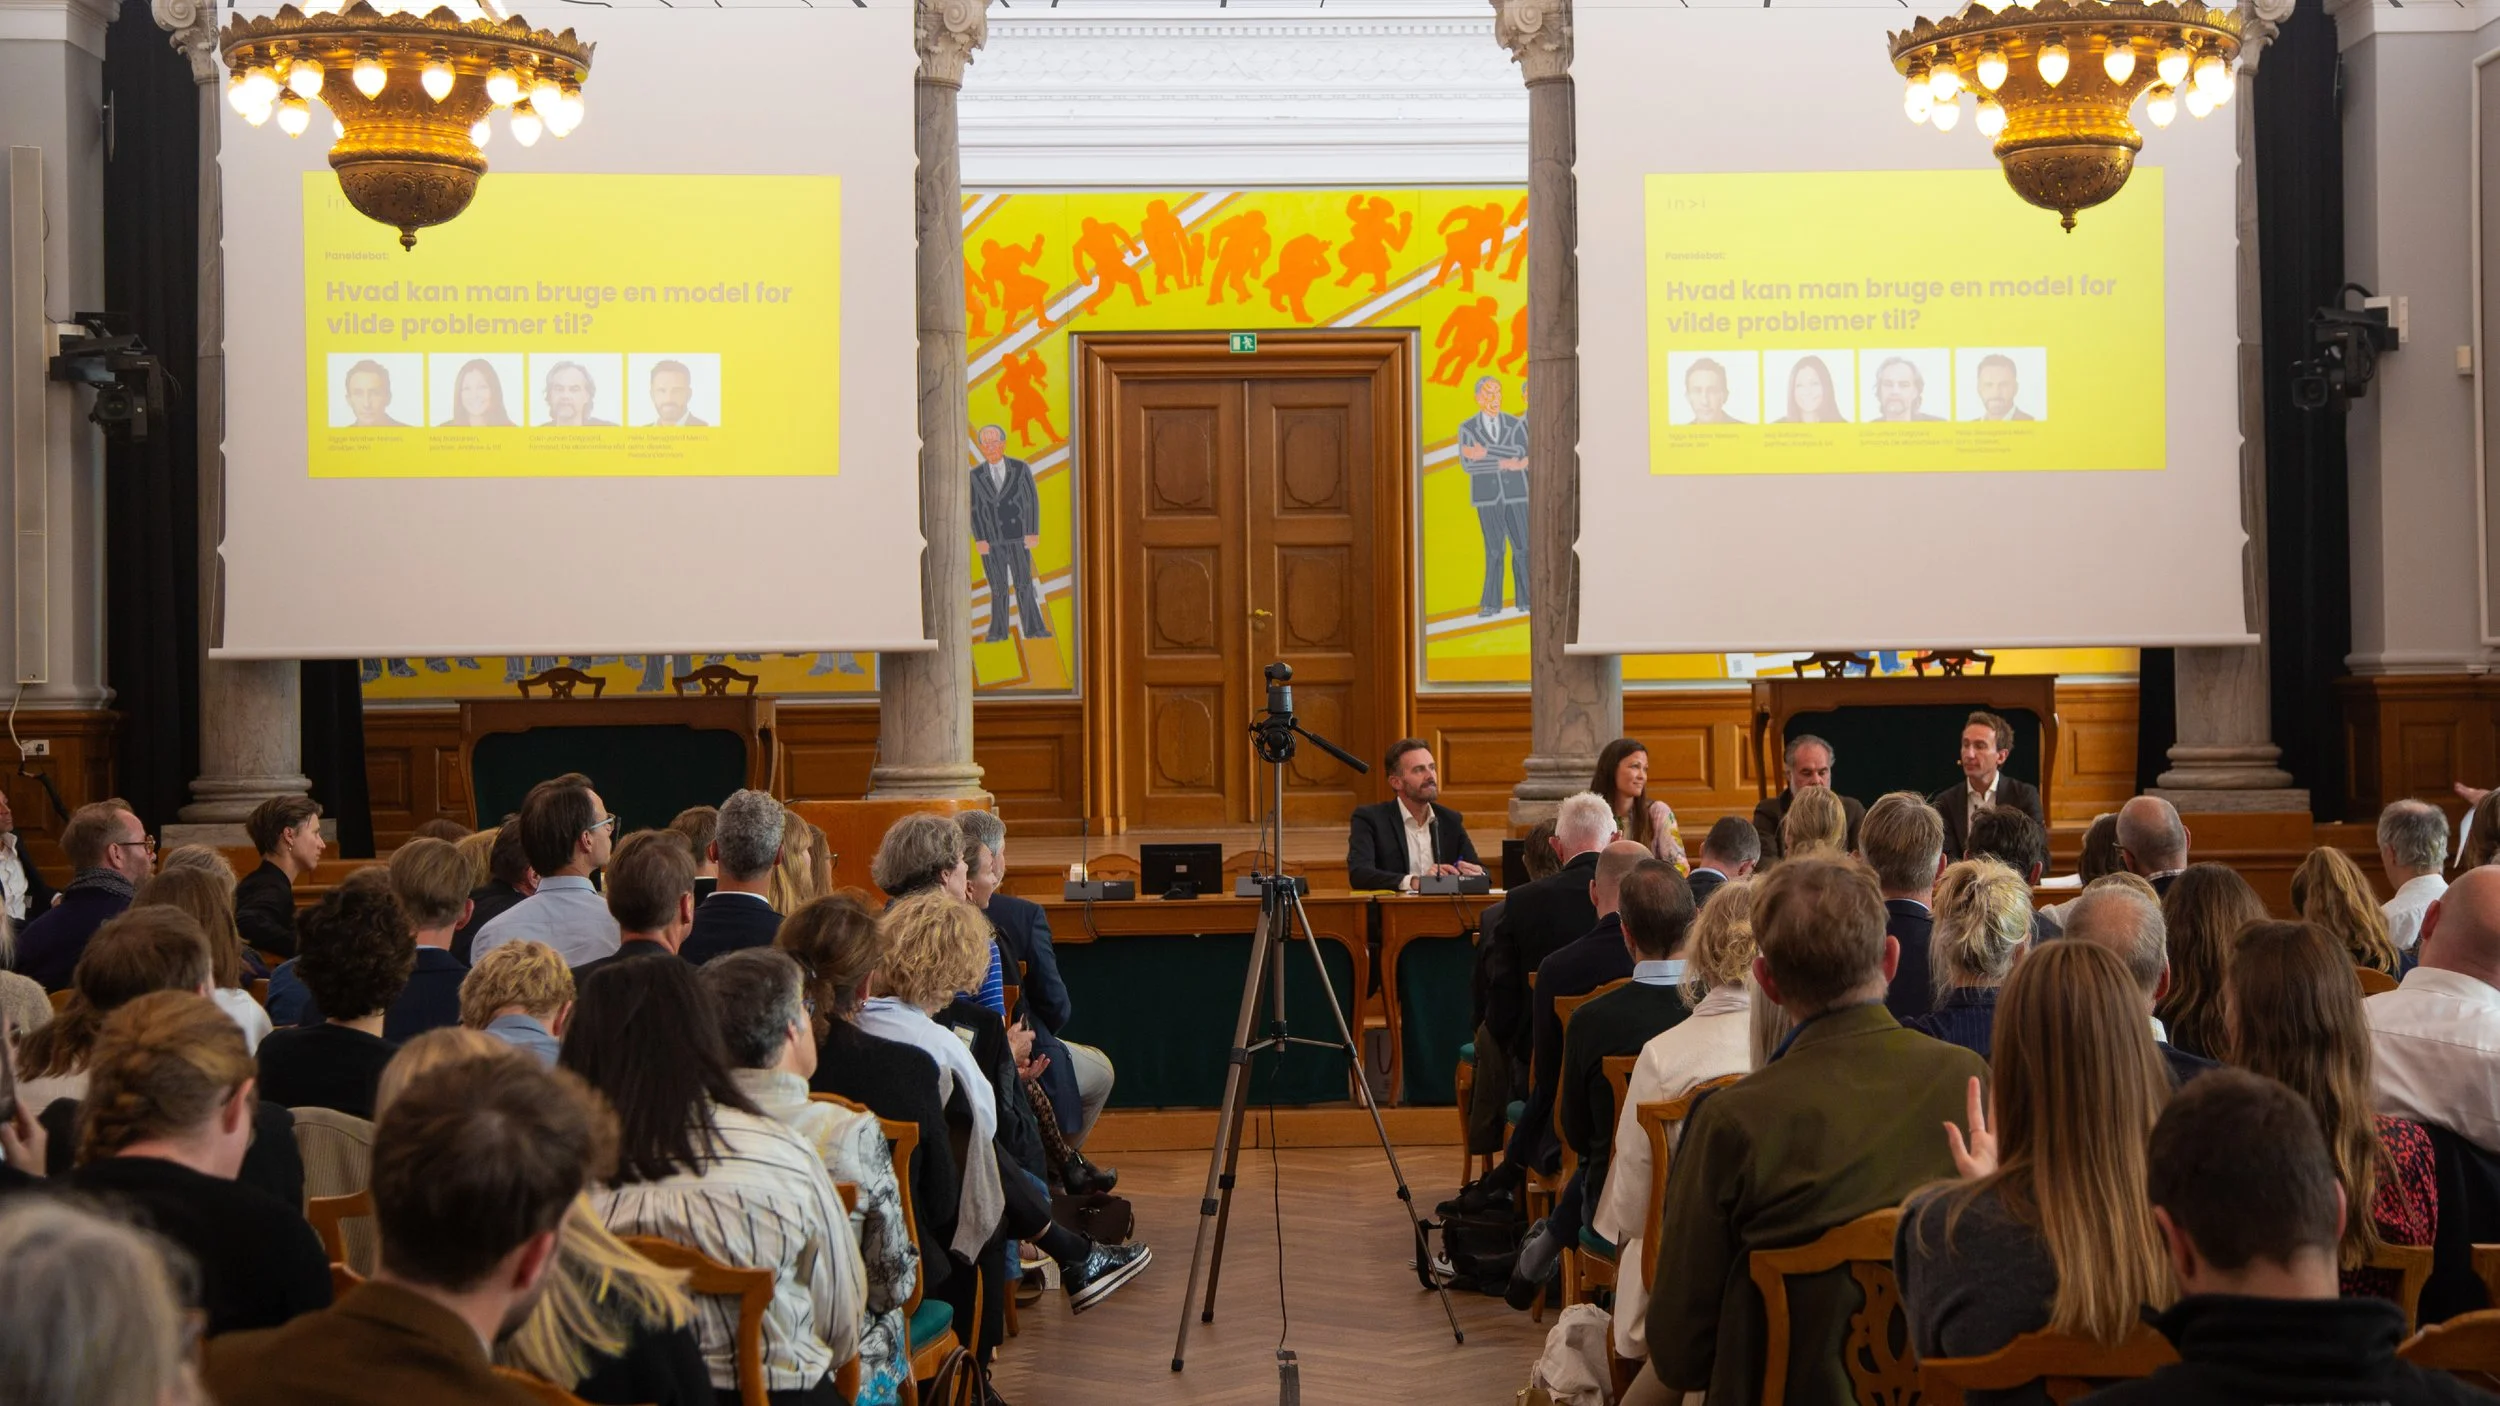
Watch INVI's hearing at Christiansborg on the "Model for wicked " with the Minister of Finance.
Watch the hearing here.
Zetland
“Few Danes believe that politicians’ proposals can be put into practice. Now a possible solution is on the horizon.”
Read the article here.
Altinget
“Invi responds to former social services director: ‘Our model isn’t a magic wand that solves wicked .’”
Read the article here.
FAQ About the Model
-
We've gone from 8.5 million words in legislation in 1989 to 35.2 million words in legislation in 2024. All the while, societal problems have become more intertwined. We formulate lots of policy, but change often fails to happen.
A survey we conducted shows that only 14% of Danes believe that all policies that are adopted can actually be implemented. This trend is also confirmed by many people behind the walls of power.
And more and more practitioners implementing legislation are tired of quick reforms and quick fixes - and their motivation, research shows, is crucial to whether legislation gets out there and lives.
Increasing complexity, wicked problems and lack of motivation call for help to reduce complexity, make inroads and practitioners regain their motivation.
It is based on insights from research, survey data, reports, experiences and needs that INVI introduces our Model for wicked Problems.
A model that tries to help government navigate complexity. A model that wants to bind decision-makers and voters closer together in the implementation of policy.
-
The short answer is: No.
The famous British statistician George E. P. Box has freely translated the following:
"All models are wrong, but some of them are useful."
Of course, this is also the case for the wicked Problem Model. It will never be able to accurately uncover the complexity of a problem and indicate the exact course to solve it. Nevertheless, it is clear already in the model's test phase that the dialogue with potential users of the model in ministries, municipalities and organizations sees it as very useful.
-
There is nothing wrong with the existing knowledge. On the contrary. The wicked model provides a supplement to the data sources on which decisions are typically based—surveys, economic analyses, and standard evaluations. Where a survey asks predetermined questions with closed-ended response categories, the model works with open-ended inputs, where respondents express themselves in their own words. It captures the perspectives and nuances that closed-ended questions would never uncover—and provides a more accurate picture of what is actually happening in a field. Research and evaluation document the outcomes of an initiative. The wicked Model tells you what people are thinking, experiencing, and disagreeing about—while the change is happening.
-
Respondents are always selected in close collaboration with the client and subject matter experts. For example, when we work on the implementation of the Elderly Care Reform, we assemble an implementation group consisting of the stakeholders most closely involved with the issue: government officials, managers, social and health care assistants, nurses, older adults, and their relatives.
A common objection is that professionals base their answers on their own interests. Our experience shows the opposite: when professionals are asked a technical question, they generally base their answers on their specific experience with the issue—not on ideology or union positions. This is confirmed by our projects across various fields.
-
Model for wicked is built on a secure digital infrastructure that complies with GDPR, and all data is stored within Europe. The AI models we use in our analysis are not trained on the data we process. Citizens’ inputs are used exclusively for the purpose for which they were collected.
-
The wicked Model was developed for organizations that deal with complex issues and need to better understand them—by bringing together a wide range of voices and perspectives. This typically includes government agencies, local governments, foundations, advocacy groups, and NGOs. What they have in common is that they face decisions that cannot be made based on numbers alone. However, the model can also be used by researchers and others with an interest in the subject.
-
This model is particularly valuable when you’re facing a problem that’s difficult to define precisely, where there are many stakeholders with different perspectives, or where previous solutions haven’t worked as intended. It’s ideal when you don’t know all the angles of an issue and need to gain a better understanding of what’s actually happening in the field. And it is particularly effective when entrenched positions among key stakeholders call for a new shared knowledge base—a neutral starting point that everyone can rally around. Finally, it can be used to continuously monitor whether an initiative is actually making a difference over time.